Unicorn Market Cap 2023: Rise of AI
We analyze growth in unicorn market cap by region. We also compare # of Barry's Bootcamps to # of unicorns for key cities.
[This post co-authored with Shreyan Jain]
We’ve previously explored the geographic distribution of global unicorn market cap in 2019, 2020, and 2021. In the past, we’ve used this analysis to highlight trends like the concentration of tech startups in specific industry-towns, a slowdown in new unicorn creation in China, and the prevalence of post-Covid remote work policies in the Bay Area.
A lot has happened since early-2021, including public tech market and multiples highs, ZIRP (Zero Interest Rate Policy), inflation, interest rate hikes, and a massive public market stock valuation correction, so now is a good time to re-examine what unicorn market cap looks like.
Big Takeaways / TL;DR:
Despite the “you can build a startup anywhere” mantra during COVID, unicorn market cap continued to aggregate in the USA (53% of global market cap). Indeed, 40% of all the unicorn market cap in the world continues to be found in just 3 US cities: SF Bay Area (26%), New York (8%), and LA (6%).
The wide distribution of cities with just 1 unicorn (up from 37 to 75 in 4 years) likely reflects a rise in “ZIRPacorns”, to coin a term, rather than a true decentralization of important startups. ZIRPacorns are unicorns that would probably be worth dramatically less than $1 billion if not for the COVID/ZIRP-era multiple excess.
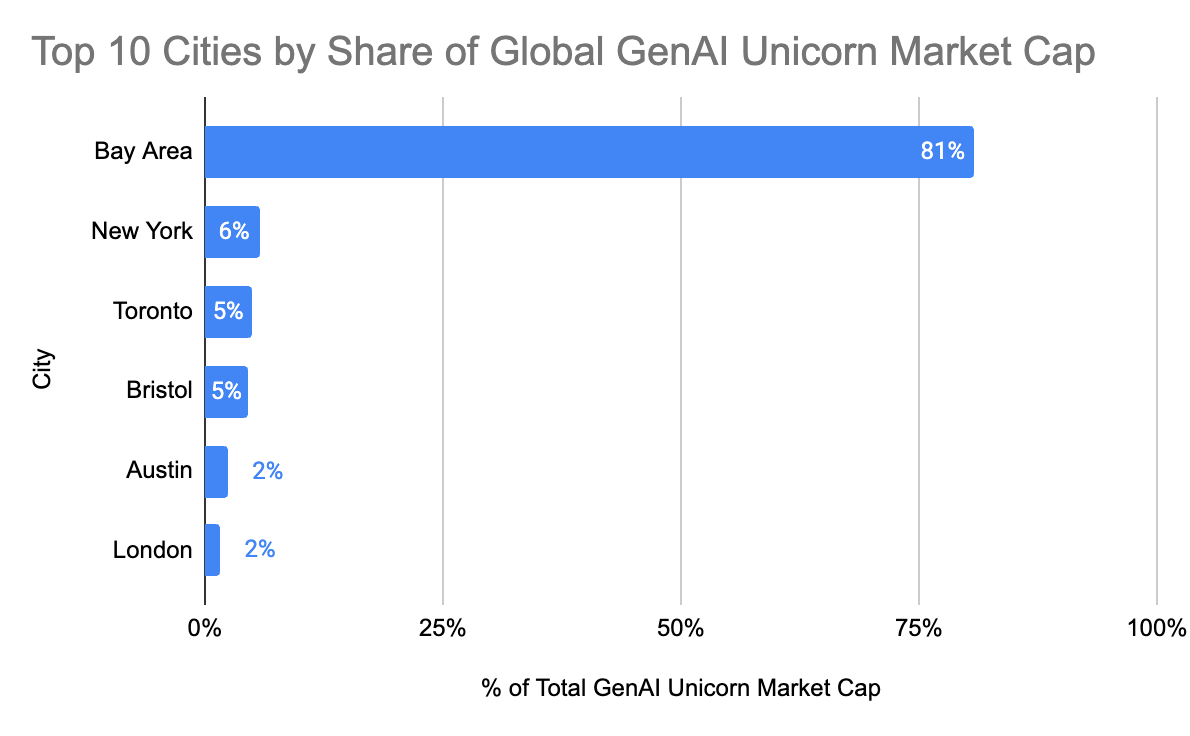
SF has emerged as the center of AI unicorn market cap with an 81% initial market share of generative AI companies. It is, of course, quite early days and this will likely evolve with time.
NY has grown global unicorn share from 5% to 8% since 2020. Of the top 10 unicorns in NY, 6 are crypto and 3 are fintech, suggesting that NY is a fintech/crypto cluster to date morphing towards a general purpose ecosystem. LA also grew its share during COVID - largely due to a mix of SpaceX and other defense or space companies like Anduril and Relativity. These 3 companies make up 67% of LA market cap.
Paris and London also gained share, while China has continued to lose share over the past few years.
A few cities or regions are highly dependent on single companies for much of their market cap. For instance, Bytedance makes up 58% of Beijing’s total market cap of $387B, SpaceX is 62% of LA’s $222B, and Shein is 64% of Shenzhen’s $157B.
Miami, Austin, and others have many Barry’s Bootcamps, but fewer unicorns than popular perception might suggest (see chart). We look at the Barry’s/Unicorn ratio of key cities. SF Bay Area is dominant with a unicorn/Barry’s ratio of 48. This is of course a lagging indicator and we think Miami in the long run may benefit from talent turnover coming from NY, much as LA was by the Bay Area. Alternatively, the Bay Area may become more fit and reduce this ratio.
Caveats
All raw data was taken from CB Insights and can be found here. Some caveats:
The data for the 2023 batch of unicorns was downloaded on July 20, 2023 and may not include all recent unicorns.
The listed market caps are based on last-round valuations, many of which are inflated 2021 numbers and may not reflect current fair-market value.
Unicorn market caps are inherently backwards-looking and may not adequately capture trends that we’re still in the early stages of, such as the market reset for growth-stage companies or the proliferation of generative AI.
There are undoubtedly errors in market cap, mismapping of a company to a city, etc across multiple years of data. That said, major trends should hold.
New Unicorns
The number of unicorns has exploded from 44 in 2012 to 1215 today—a nearly 30x increase in roughly 10 years. Going back to 2019, the number of unicorns has roughly doubled every 2 years, with new unicorns in any given period outpacing existing unicorns that “graduate” via an IPO, acquisition, or downround. Since June 2019, 6 times as many private companies become unicorns (1094) as the number of unicorns that became publicly traded companies (172).
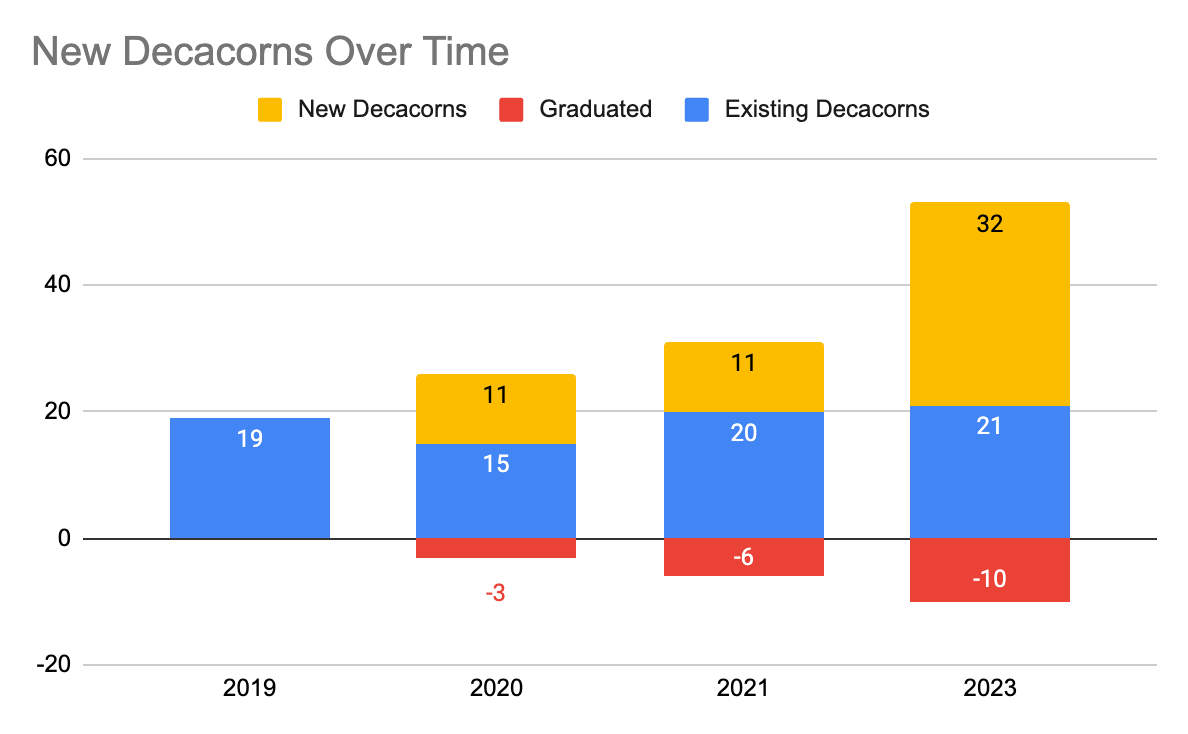
In both 2020 and 2021, new unicorns accounted for roughly 40% of all unicorns; that rate has shot up to 52% today. This trend becomes even more apparent when you look at decacorns; companies that crossed the $10B mark within the previous years account for 60% of all decacorns today, up from 35% in 2021.
New unicorn creation in the past 3 years spiked in 2021 and early 2022 before falling back to pre-COVID norms in the last year (it’s likely the data here is off by a few months, since there’s a lag between when fundraising rounds close and when they get publicly announced and recorded in datasets like CBI).
In 2020-2021 interest rates dropped, stimulus was pumped into the economy, and both public and private valuations soared. Assuming private market valuations followed public ones, many private companies were overvalued by 3-4X at their peaks. This suggests a threshold of $3 to $4 billion market cap at time of funding in 2020-2021 equates to a “normal” $1 billion company in non-ZIRP times. Indeed, when we compared 2019 (at $1B) and 2021-2023 (at $3B) vintages in terms of new unicorn distribution, we saw nigh-identical patterns.
Since COVID there has been a large reset in public market valuations with many technology companies losing 50-90% of their market caps. Private markets adjust slowly, with markdowns, firesales, and shut downs often going unreported. We would anticipate many of the unicorns from the last few years will lose their status as $1B+ companies in the upcoming years.
Unicorn Creation by Region
The US drove the majority of new unicorn creation in the last 2 years, accounting for 56% of brand new unicorns by count and 57% of new unicorn market cap. Although China’s velocity of new unicorn creation has bounced back a bit since a decline in 2021, it still lags behind the United States and has now been overtaken by Europe, with India nearly catching up as well.
Some city-specific trends:
SF Bay Area and New York continued to grow or maintain their global unicorn market cap share. SF stayed level at 26% from 2021 to 2023, while NY grew its share from 6% to 8%.
London saw its unicorn count double from 2021 to 2023 and has continued to be the primary tech industry-town in Europe. Paris and Berlin are the next 2 major drivers for new unicorns in Europe.
Beijing still accounts for more unicorn market cap than New York in absolute terms, but New York added 6 times as many new unicorns and 8 times as much new unicorn market cap in the past 2 years.
Tel Aviv has grown rapidly despite the small population of Israel; it added more unicorns in the past 2 years (15) than it started off with in 2021 (10), and has nearly tripled its unicorn market cap.
Unicorn Concentration by Region/Country
When we look at total unicorn numbers rather than just new unicorns created since 2021, the US’s dominant position becomes even clearer. The US has actually increased its global share of unicorns – in terms of both count and total market cap – over the past few years. Every other region also saw its share of total unicorn count and market cap increase except for China, who went from housing 26% of all global unicorns in 2019 to just 15% today, and from 30% of global unicorn market cap down to 20%. Europe has almost closed the gap, and in fact already has almost as many unicorns (165) as China (178).
When we break regions like Europe, APAC, and LATAM into their respective countries, we can see that 82% of all unicorn market cap is concentrated within just 4 countries: the US, China, India, and the UK. Every other country accounts for <= 2% of global market cap.
Unicorn Concentration by City
One of the most interesting consequences of ZIRP has been a proliferation of unicorns outside of major cities. In particular, the number of cities with exactly 1 unicorn has doubled from 37 in 2019 to 75 in 2023, and the number of cities with <= 2 unicorns has also >doubled from 48 to 102:
The current day distribution of cities by their unicorn count clearly shows this fat tail of “one-hit wonders”:
Although this has led to some diffusion of global unicorn market cap, most value continues to be concentrated in the tech clusters on the right side of this graph; the top 15 cities across the world account for almost 75% of all unicorn market cap.
Outliers & Ecosystem Dominance
There are 3 companies – Bytedance, SpaceX, SHEIN – with market caps above $100B; The next largest unicorn is at roughly $50B. These three outliers make up a disproportionate share of not only global unicorn market cap (12%), but also the unicorn market cap of their respective cities (Beijing, Los Angeles, Shenzhen) – around 60% in all three cases.
In a way, these 3 outlier cities take the “power law” of VC to an extreme—they are home to a fat tail of low market cap unicorns, but virtually all the returns are concentrated in the biggest “winner”.
We view dispersion of market cap across many companies as a broader signal of startup ecosystem health. For example, the largest companies in both the SF Bay Area (Stripe) and New York (OpenSea) only make up 5% of their respective regional market cap.
US clusters
The top 10 cities in the US make up almost 90% of its total unicorn market cap, led by the Bay Area, New York, Los Angeles, Boston, and Seattle (same order for top 5 by unicorn count, except for Boston and LA flipped). LA is dominated by aero/astro and defense companies, with SpaceX, Anduril, and Relativity combining to make up two thirds of total LA market cap. Meanwhile, Boston is dominated by biotech companies—home to 30% of global biotech unicorn market cap.
New York is a fintech and crypto cluster
Looking at the top 10 unicorns in New York today, it’s clear that its ecosystem has specialized in fintech (9 of top 10) and crypto (6 of top 7). Of the 10 most valuable private tech companies (on paper) in NY, all 10 became unicorns for the first time between July 2020 and November 2021. A number of these ran up from $1B to $6-13B in market cap during ZIRP and COVID. A subset will be sustainably valuable; for example Ramp recently repriced to $5.8B—still a great outcome when public market companies are down 50-80%.
SF Bay Area is the early winner and cluster for generative AI
Although we’re still in the earliest days of what’s looking like a monumental wave, it’s becoming clear that the Bay Area has emerged as an early leader for generative AI companies, with a 81% market cap share. This should be a strong tailwind for the US broadly and the Bay Area specifically to continue growing their share of global unicorns. It is, of course, the very early days of generative AI so we anticipate more global market cap emerging over time.
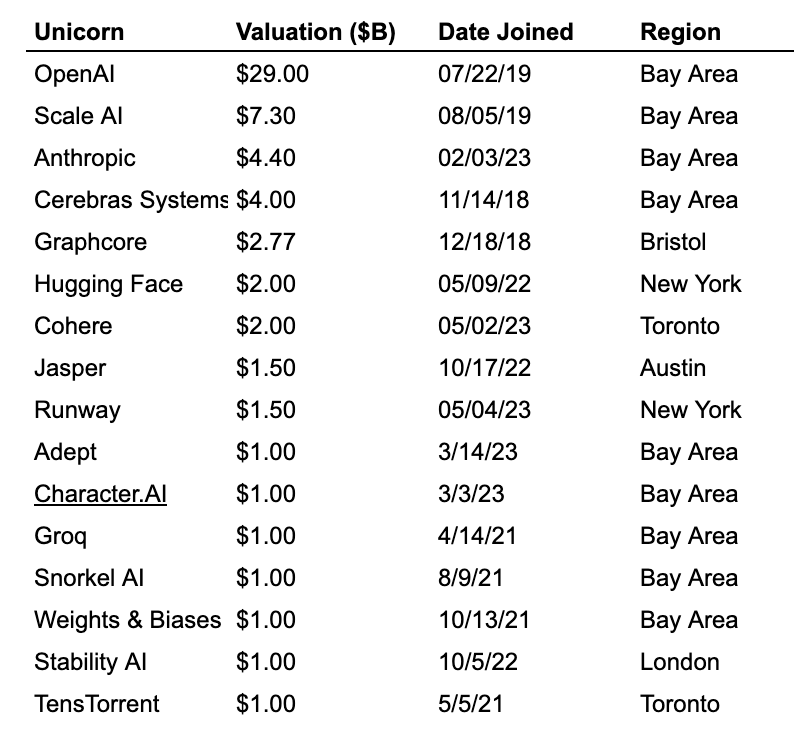
Note: Below are the companies we considered to be “generative AI” companies for the sake of this analysis; this includes a few GPU companies (Cerebras, Graphcore, TensTorrent) who have enjoyed record growth due to the recent compute demands imposed by foundation models and other gen AI providers. Excluding them would only strengthen the Bay Area’s total concentration.
Unicorn Market Cap Vs Barry’s Bootcamp Locations
A popular narrative over the last few years has been the emergence of Austin and Miami as tech centers. While both regions hold promise for future growth, both are still smaller contributors to new unicorn formation as of today.
Austin has the 7th most unicorns in the US and the 10th most market cap, after Chicago, Jacksonville, and San Diego (the latter two may reflect biotech market cap, versus tech market cap). Miami is home to 7 unicorns worth $15.8 billion, just behind 10th place San Diego (8 unicorns, $30B in market cap).
Comparing unicorn market cap to the number of Barry’s Bootcamp locations by city shows that the Bay Area has 48 unicorns per Barry’s, while LA has just 3 and Miami has just 2. This is due to a higher number of Barry’s per capita in Miami and a lower number of unicorns. NY and Austin both net out at about 15-17 unicorns per Barry’s. Overall this suggests that perhaps the Bay Area is out of shape. We will continue to track this important metric ongoing.
Chinese unicorn market cap often dominated by single companies
Beijing and Shanghai account for 3 out of every 5 Chinese unicorns and two thirds of total market cap. Shenzhen’s $157B unicorn market cap is almost entirely driven by a single unicorn, SHEIN ($100B).
India Clusters
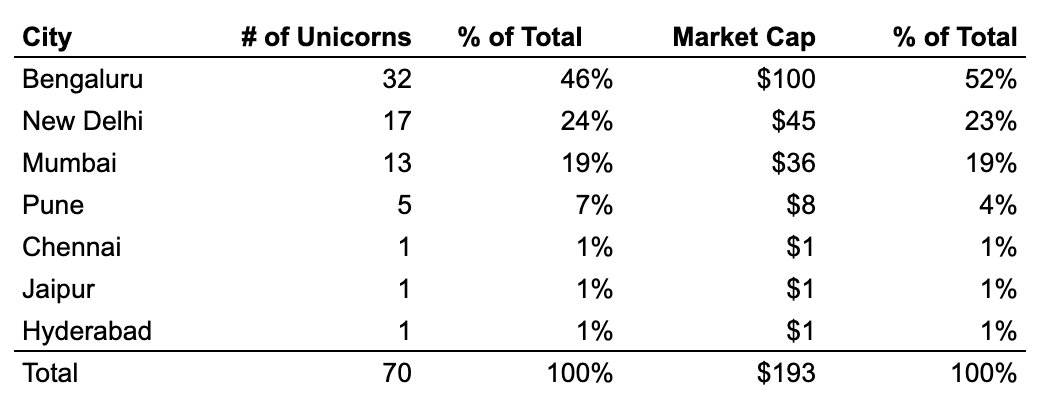
India unicorn market cap is centralized by 3 cities – Bengaluru, New Delhi, and Mumbai – which account for nearly 90% of unicorns and nearly 95% of all unicorn market cap.
When we look at these figures over time, we can see that Bangalore and Mumbai continue to grow while new unicorn creation in New Delhi has slowed.
Europe Clusters
Although it has its own centers of unicorn concentration, Europe is unlike most other global regions in that an outsized share of unicorn market cap has existed ongoing outside of major industry-towns. While the share of total unicorn market cap within the top 3 cities is ~75% for the US, ~85% for China, and ~95% for India, the top 3 cities in Europe – London, Paris, and Berlin – only account for ~55% of its total unicorn market cap, a significantly lower share.
This is almost entirely driven by a fat tail of cities with 1 or 2 unicorns; although both the US and Europe are home to exactly 47 cities with at least 1 unicorn, there are 37 cities with 1-2 unicorns in Europe (nearly 80%), compared to just 26 such cities in the US (55%)
Over the past 4 years, London and Berlin have both held steady at around 35% and 10% of total European unicorn market cap, respectively. Meanwhile, Paris has been on a breakout trajectory, steadily increasing its share of European unicorn market cap from ~5% to ~12% over the same time period, and crossing Berlin to become one of the region’s most important industry-towns in 2021 (more than 80% of Stockholm’s market cap in 2021 was made up by a single unicorn, Klarna).
The End of ZIRP: What happens to the ZIRPacorns?
One hypothesis is that, on average, unicorns outside of industry towns may be less likely to sustain their market caps than unicorns in industry towns. Part of this is the anecdotal belief that VC investors became anxious during ZIRP to find “hidden gems” and therefore funded many marginal companies outside of major tech hubs.
The first signs of the recent turnaround in macro conditions comes in the form of a global slowdown in new unicorn creation. Given the money raised in 2021 by startups, we anticipate it will still be anywhere from 1-3 years before many companies run out of money and need to fundraise/reprice. There are likely 3 long-term outcomes for these companies:
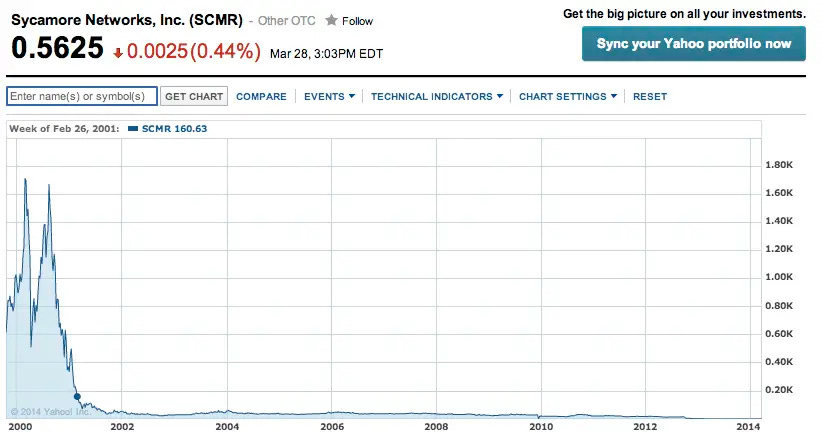
Shutdowns, small exits, and slow burn down. Sycamore Networks, one of the many high fliers of the dotcom bubble, continued operations for nearly 12 years as a public company running off the cash it raised in its IPO. It spent the last 5 years trading roughly at the same value as its cash holdings.
Terminal value companies. Many late-stage companies may be at the highest valuation they will reach in the near run. Many unicorns of today may end up being worth only 20-50% of their current high water mark. They will survive ongoing, but perhaps have reached their terminal valuation early.
Companies that grow out of it. It took nearly 10 years for Amazon to regain its dotcom era high-water mark of around ~$50B after the crash; today it stands at $1.4T, a near-30x.
There is reason for optimism in tech
Despite the gloomy prognosis for many mid- to late-stage private tech companies, there is a lot of room for optimism as well. This includes the aggregate revenue being generated by SaaS companies continuing to scale rapidly (in other words, real value is being delivered by tech companies at scale) and the generative AI wave is remaking how we think about software. There is a lot of room for innovation and exciting times ahead.
MY BOOK
You can order the High Growth Handbook here. Or read it online for free.
OTHER POSTS
Firesides & Podcasts
Markets:
Startup life
Co-Founders
Raising Money
Old Crypto Stuff:


