Unicorn Market Cap, June 2021 (Almost Post-Pandemic Edition)
I have previously written about Unicorn Market Cap and Industry towns in 2019 and 2020. Over the last 8 months the number of tech startups worth $1B or more ("unicorns") has grown by 43% from 487 Unicorns to 701. This is almost double the 361 unicorns in June 2019 (!).
Data was taken from CB Insights and a special thank you to Shin Kim, CEO of Eraser for the data and graphs.
Caveat emptor: data from CBI is updated/reconciled over time, so very recent unicorns may not be included yet. However this provides a directional view.... Raw data here.
NEW UNICORNS

The regional nature of private tech market cap continues to dominate. The big shifts over the last year include:
NEW UNICORNS SINCE OCTOBER 2020

(1) United states: Over 67% of the new unicorns by # are in the USA with 154 total. (out of 227 globally)
There were 69 new unicorns in Silicon Valley, 30 in New York, and 8 in Los Angeles.
This is increasing share for both the USA & Silicon Valley as a % of global tech unicorns, with NY and LA accelerating somewhat. New York anecdotally feels like it has transitioned into a break out cluster of its own.
The pandemic has increased unicorns in the USA at a fast clip.

(2) China has slowed on new unicorn generation.
While China is 29% of all unicorn market cap, it only added 9 new unicorns (roughly 4% of global total) since October 2020.
The decline in new unicorn formation in China is striking. One potential interpretation is it at least in part a data issue. For example, 20 or so Chinese unicorns from pre-2020 were just added to this data set as a historical reconciliation. Other interpretation in the last section below.
(3) Europe added 25 unicorns.
London (8 new unicorns for a total of 21), Paris (5 new unicorns for a total of 13), Berlin (5 new unicorns for a total of 9), and Stockholm (2 new unicorns for a total of 4, including a decacorn) added the most new unicorns.
(4) India added 11 unicorns.
Major cities to add unicorns included Bangalore (7 new unicorns for a total of 14), New Delhi (2 new for a total of 12), Mumbai (1 new unicorn for a total of 4), and Chennai (1).
OVERALL CONCENTRATION
The overall Unicorn rankings have remained the same. The USA is the clear front-runner, China next, followed by the EU and then India. Israel continues to have a large number of unicorns per capita and Canada has started adding them at a faster clip then before (4 new unicorns in Toronto alone in the last 10 months). Brazil is the biggest generator of unicorns in Latin America.
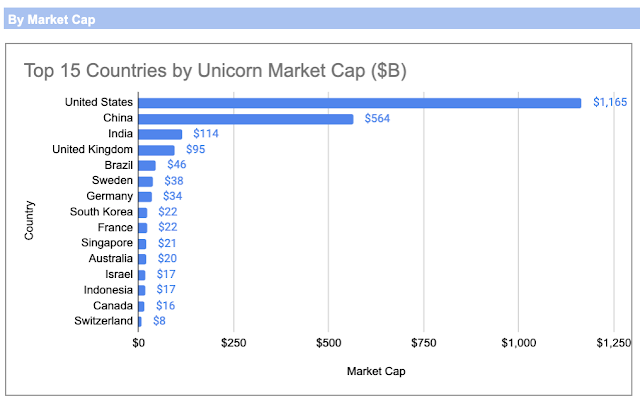


Unicorn market cap is highly concentrated by specific cities:

DECACORNS: $10B or larger market caps
Decacorns are largely concentrated in a handful of countries - although a number of decacorns have gone public in e.g. Indonesia and others.


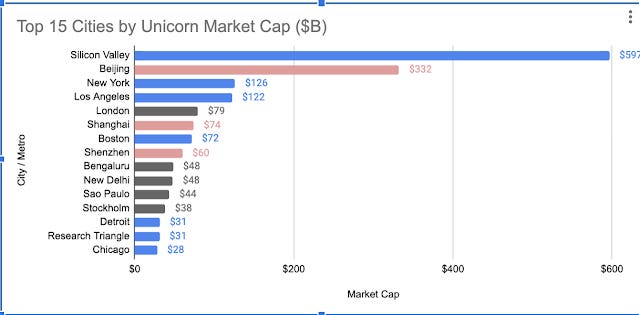
UNICORN REGION AND CITY CONCENTRATIONWithin each country, specific cities or regions continue to make up 50% or more of the country unicorn market cap.


For example, Silicon Valley is 51% of the US market cap and 47% of unicorns by number. New York is 11% of market cap and 17% of unicorn by number, and Los Angeles is 11% of market cap (largely due to SpaceX) and 7% of US unicorns by #.
Clusters & industry towns clearly continue to matter.
Europe has a number of centers with London the largest by a margin, followed by Stockholm, Paris, and Berlin.
Beijing (59% of market cap due to ByteDance and 37% of # of Chinese unicorns) and Shanghai (13% of market cap and 24% of unicorns) are the largest in China.

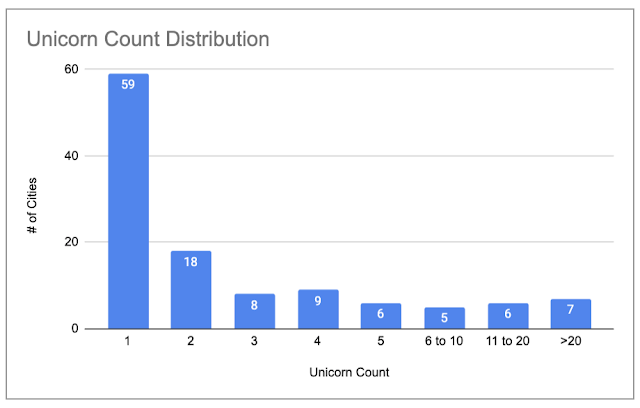
LOTS OF CITIES HAVE 1 UNICORN
While 77 cities around the world have at least 1 unicorn, most are concentrated in 13 cities with 11 or more unicorns.
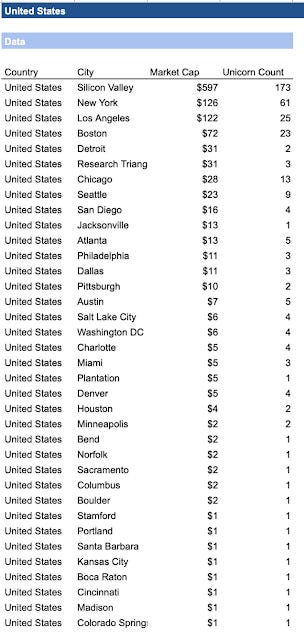
USA CLUSTERS:
"New tech clusters" are not big clusters yet
A lot of great marketing has occurred for Austin and Miami during the pandemic. Austin added 3 unicorns to get to 5 total (below new additions of unicorns in SV, NY, LA, Chicago and Boston and tied with Seattle, DC, Philadelphia). Miami added 1 unicorn to get to a total of 3 (although I am aware of at least one other that just moved there from LA that does not appear counted in the data yet). I am anecdotally bullish on the long term prospects of Miami given the people I know who moved there and the frontier feeling it has. Under discussed as future clusters with strong prospects are Denver (2 new unicorns for a total of 4) & Boulder (1 new unicorn) and Salt Lake City (2 new unicorns for a total of 4).


As noted above, Silicon Valley continues to make up 51% of market cap and 47% of total unicorns in the USA. NY has grown its share of unicorns by number relative to other US cities.


Here is the full list for the USA
CHINA CLUSTERS
Beijing, Shanghai, and to a lessor extent Shenzen continue to drive unicorn # and market cap in China.


INDIA
In India Bangalore and New Delhi continue to run neck in neck, with Bangalore having 2 more unicorns.

EUROPE (and Israel)
Europe continues to see strong clusters in the UK (where London easily dominates), Germany (ditto for Berlin) and France (ditto for Paris).
UK:


Germany:


In Israel, Tel Aviv continues to be the main cluster.

UNICORN GRADUATION
In parallel to new unicorn formation, unicorns also "graduate" via an IPO/DL/SPAC, an acquisition, or going out of business.

As unicorns graduate the founders and employees of the companies may either fund other new ventures as angels or VCs, or start new companies themselves. It will be exciting to watch more tech ecosystems grow as more unicorns go public.
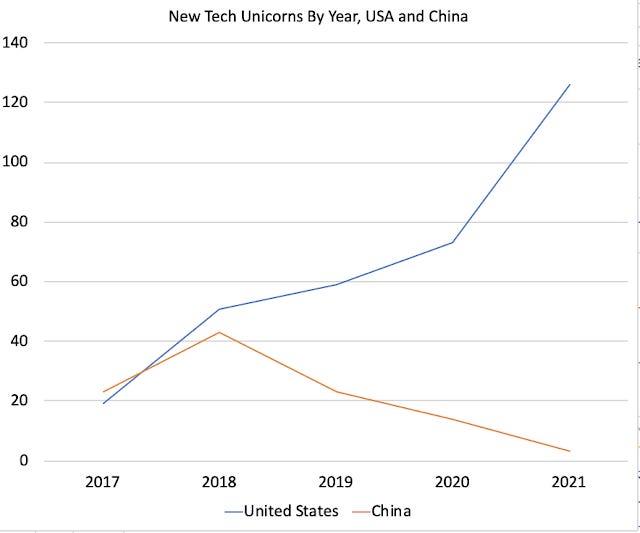
VELOCITY OF NEW UNICORNS
This data should be caveated as new unicorns from past years are sometimes added by CB Insights (who have done a great public service by aggregating this data to begin with!).
So caveat emptor on over interpreting this data. However, the difference between the USA and China on new tech unicorns over the last 2 years in notable.
Possible interpretation would include:
1. Data fidelity. Is China reporting delayed?
2. Keeping it quiet. Given the unusually high death rate (a Chinese billionaire dies every 40 days) and kidnappings of Chinese billionaires, perhaps there is now a disincentive to announce highly valued financing rounds? 眼不见,心为静。 眼不见心不烦。
3. China is producing fewer tech unicorns. This seems odd given the acceleration seen in tech due to the pandemic, but is possible.
Some of the top countries for rest of world look like this:

Raw data:

MY BOOK
You can order the High Growth Handbook here. Or read it online for free.
OTHER POSTS
Markets:
Startup life
Co-Founders
Raising Money

