Unicorn Market Cap 2026: SF is the GenAI Super Cluster
The San Francisco Bay area has morphed into a massive AI supercluster with 91% of market cap

Analysis below from Shreyan Jain. All data pulled on Dec 31st of the year, so “2025” means Dec 31 2025 / Jan 1 2026 in terms of market caps.
In the past two years, we’ve seen a post-ZIRP market correction, the rapid breakout of frontier AI labs like OpenAI and Anthropic, and ongoing punditry on an “AI bubble.” Analysis suggests that San Francisco Bay Area has emerged as an AI super cluster, with 91% of global AI private market cap residing in a 1 hour radius.
Analysis from previous years can be found here: 2019, 2020, 2021, and 2023.
Takeaways
Generative AI is creating a super-cluster in the SF Bay Area. The Bay Area now accounts for ~39% of global unicorn market cap, more than 4x higher than any other city and up from ~29% 1 year ago. Among just generative AI unicorns, the Bay Area accounts for ~91% of global market cap.
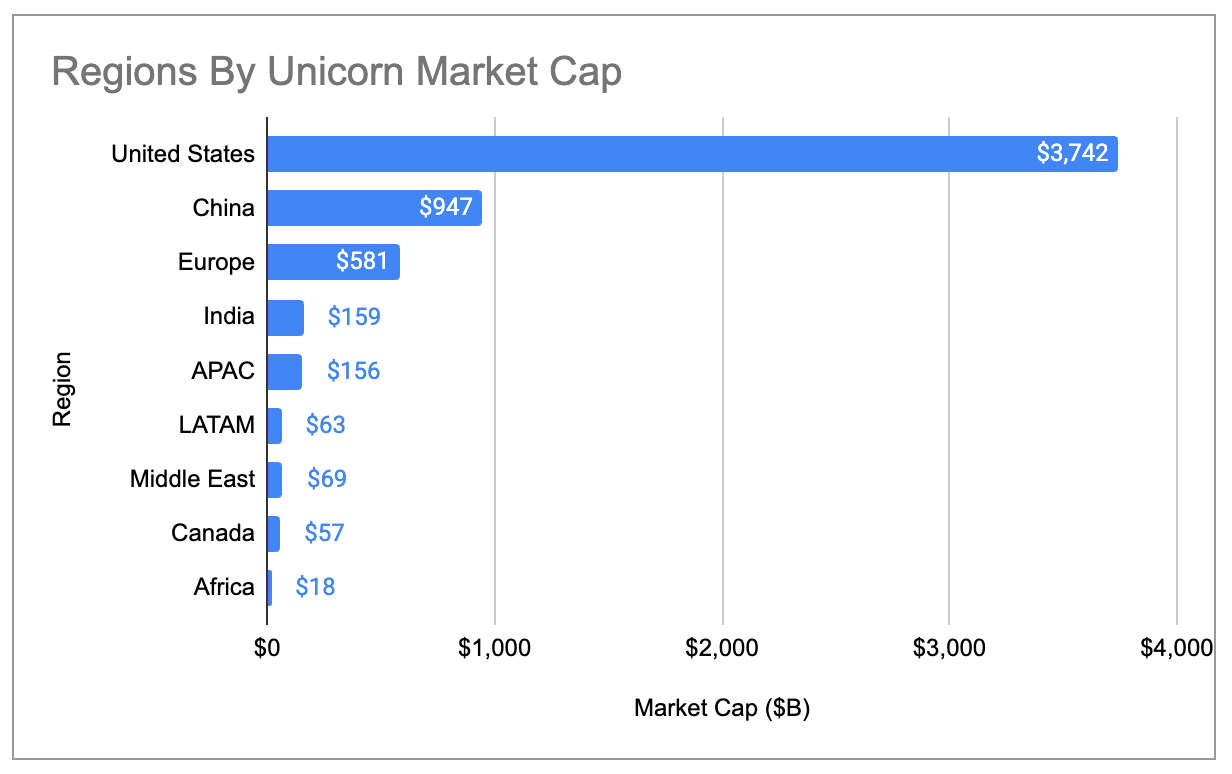
Majority of unicorns are in the US: The US added almost $1.2T of unicorn market cap in the past year and now has a ~65% share of global market cap. Europe has surpassed China in terms of global market cap share, but is still at just ~10%.
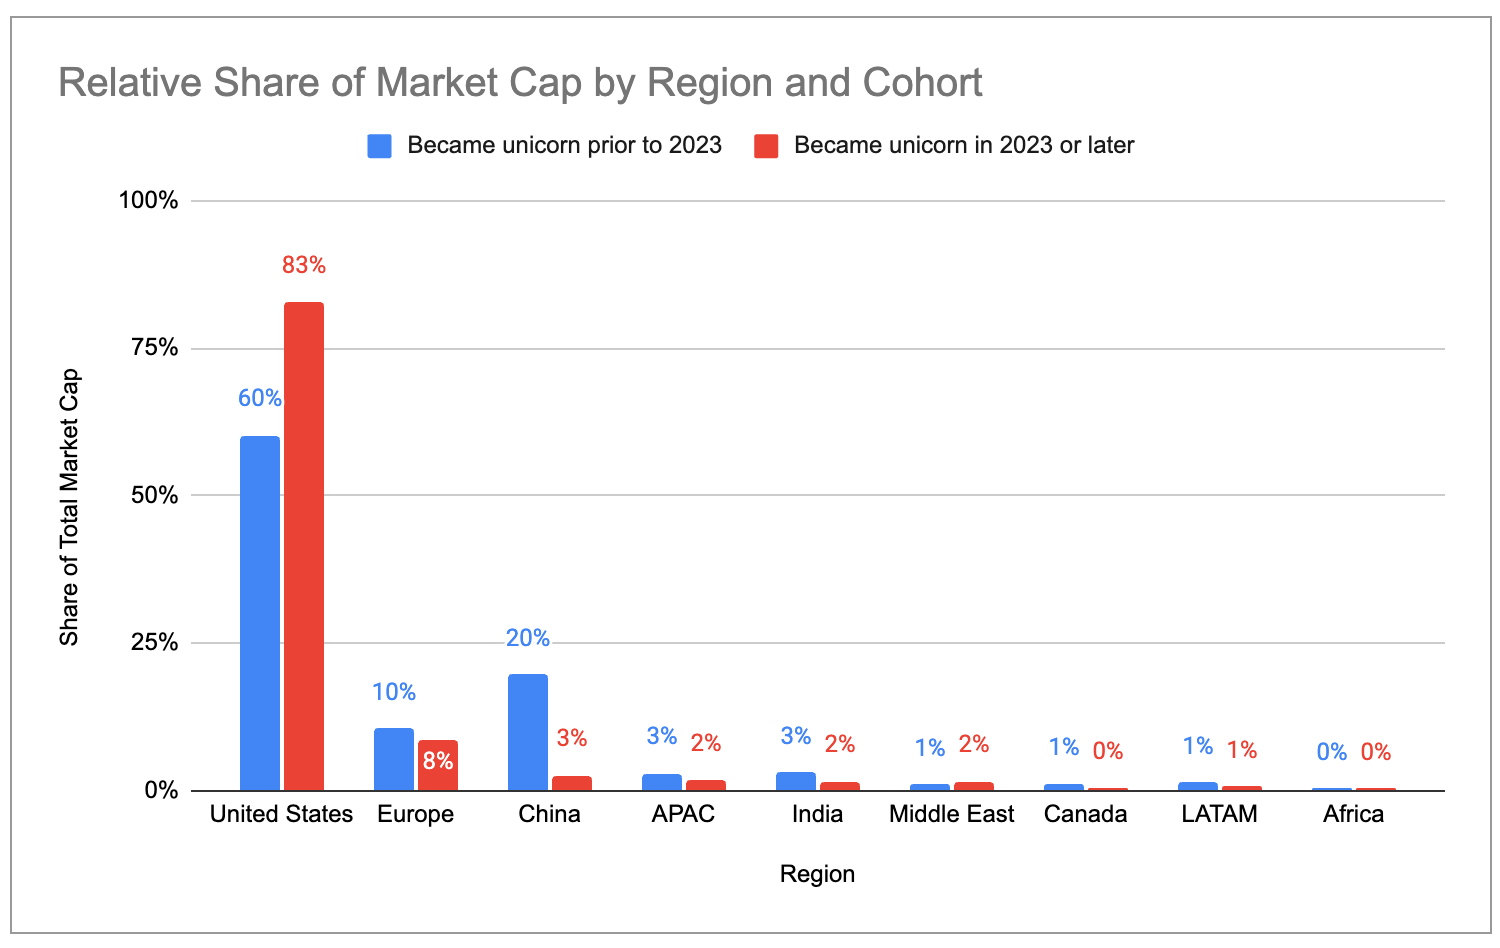
Recent unicorns are even more concentrated in the US / Bay Area. The US has 83% share of total market cap across companies that became unicorns in 2023 or later, compared to 60% across companies that became unicorns in 2022 or earlier. Similarly, the Bay Area’s share is 63% in the 2023-2025 cohort vs 33% in the 2022-or-earlier cohort.
New unicorn creation has slowed down: Just ~300 new unicorns were minted between 2022 and 2025, compared to more than 900 in the three years prior.
But existing unicorns are more valuable than ever before. While the total # of unicorns grew by just 6% YoY, the total market cap of those unicorns grew by 33% in the same time period. As a result, the average per-unicorn market cap is at its highest level in the past 6 years.
Valuation growth is mainly being fueled by growth of gen AI companies: Gen AI unicorns from 2025 grew their valuation by an average of ~$2.2B YoY, compared to ~$0.4B for non-AI unicorns. Overall, gen AI has more than 10x-ed its share of total unicorn market cap from 2% to 22% between 2024 and 2026. This means the Bay Area should become even more of a concentrated hub for unicorn market cap creation going forward.
Unicorn hubs tend to consolidate around specific industries: 6 of the top 10 unicorns in the Bay Area are gen AI companies, while 7 of the top 10 unicorns in New York are fintech/crypto companies. 3 of the top 5 unicorns in LA – SpaceX, Anduril, and Relativity – are defense/space (accounting for 83% of LA’s total market cap), and another 4 of its top 10 are consumer.
Caveats
All raw data was taken from CB Insights and can be found here. Some caveats:
Private funding rounds can take a while to be reflected in public datasets, and therefore there may be cases where unicorn valuations are stale. For example, the dataset does not reflect the latest funding rounds for companies like Anduril, Stripe, and SpaceX.
Unicorn market cap is at best a rough, backwards-looking proxy for startup activity within ecosystems, and there are undoubtedly errors in mapping specific companies to corresponding valuations, cities, industries, etc. That said, we believe the data provides a directionally correct view of major year-over-year trends.
Unicorn Concentration
Unicorn market cap has never been more geographically concentrated than it is today. The US alone accounts for 65% of all unicorn market cap, up from 58% a year ago and 44% in 2020. The US share is ~4x as much as China, which has the second highest share.
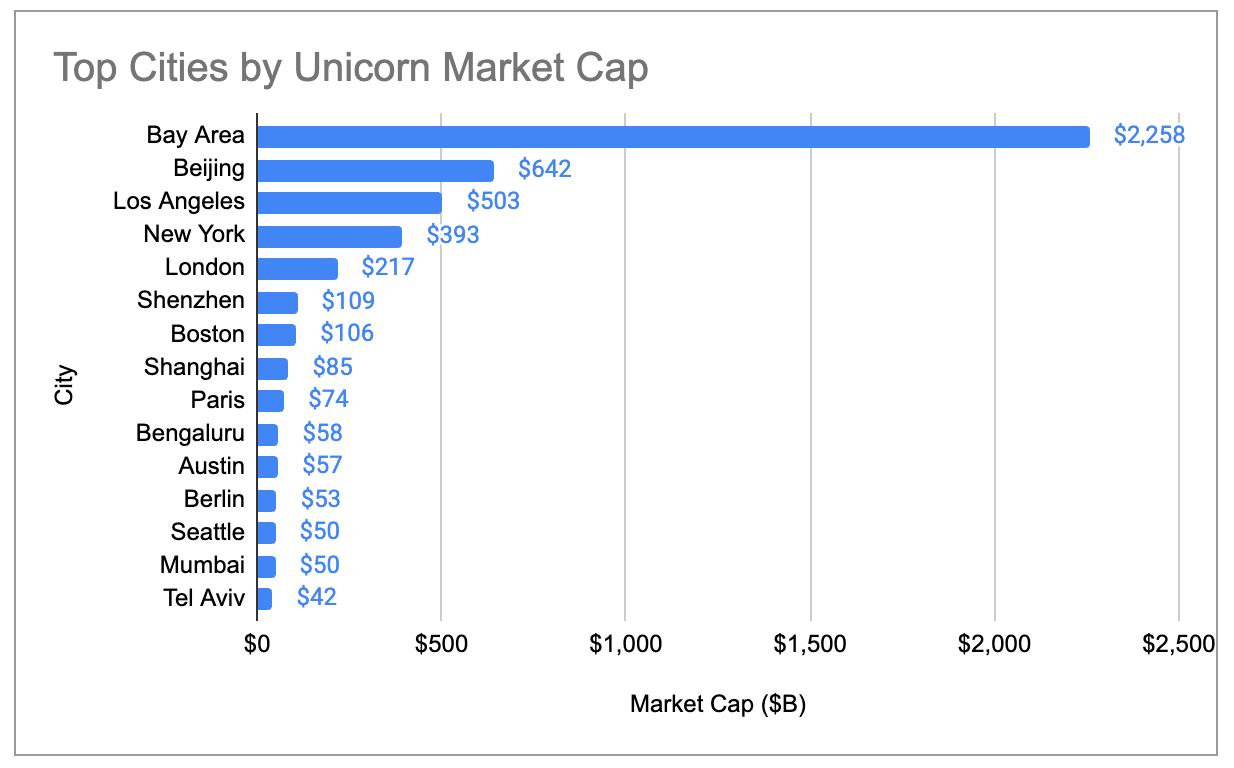
The Bay Area similarly has 4x more unicorn market cap than any other city, growing its share of global market cap from 29% in 2024 to 39% today:
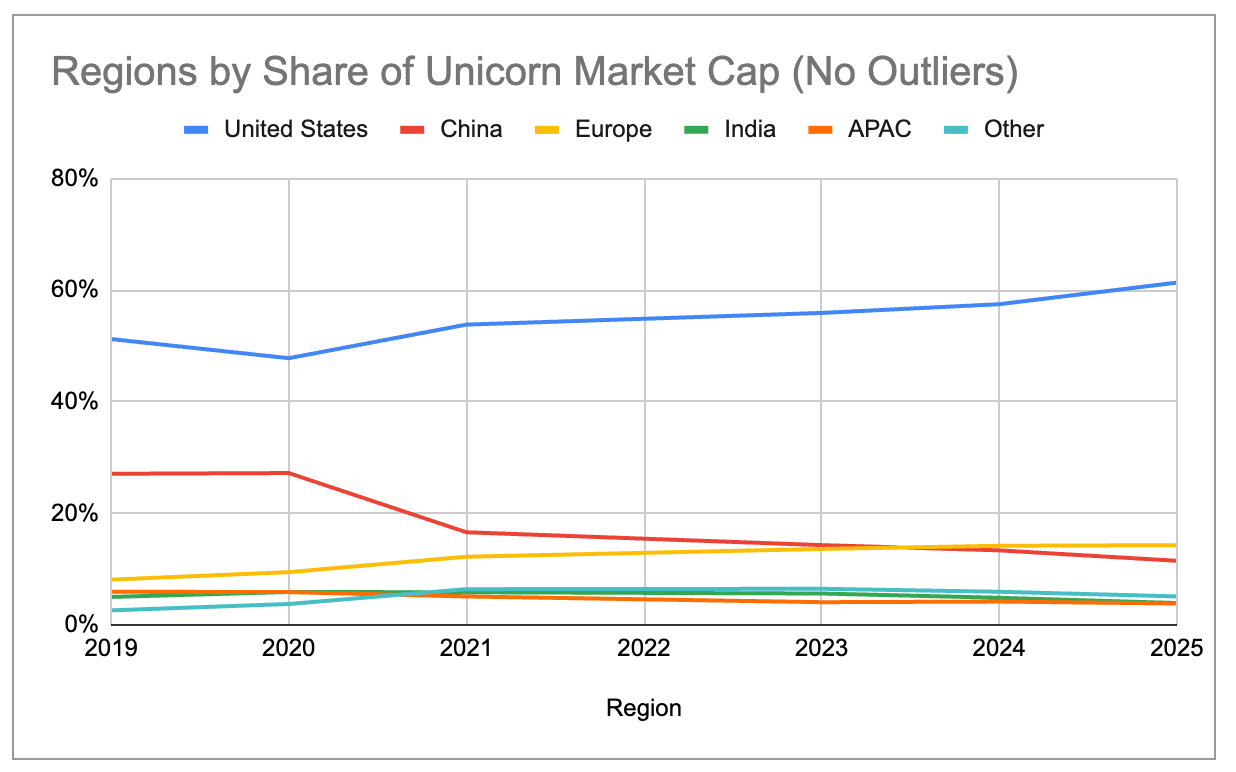
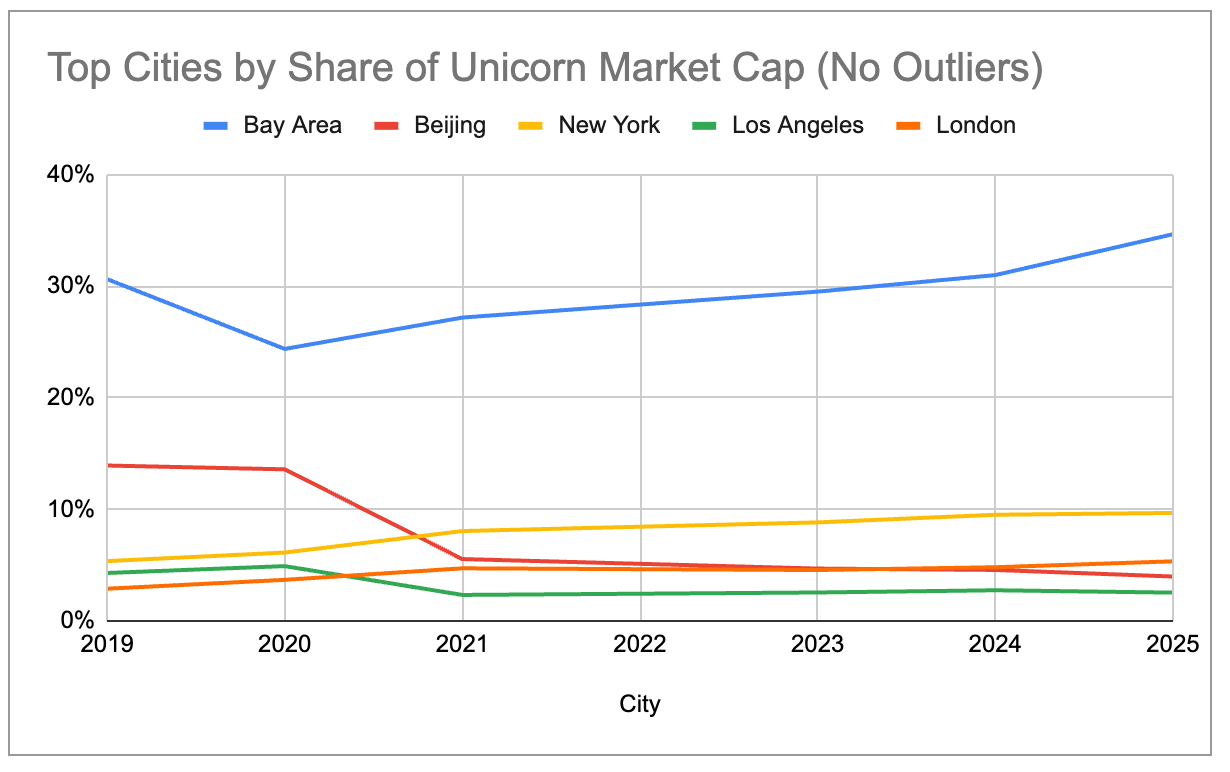
Even after filtering out the three big outliers that make up a disproportionate share of their ecosystem’s market cap – OpenAI ($500B), SpaceX ($400B), and ByteDance ($300B) – we can see that the big ecosystems are becoming progressively more concentrated since 2019. The US has been steadily increasing its share, while China has been steadily declining. Europe has surpassed China in terms of total unicorn market cap as of 2024, while New York and London have now overtaken Beijing.
Gen AI Concentration
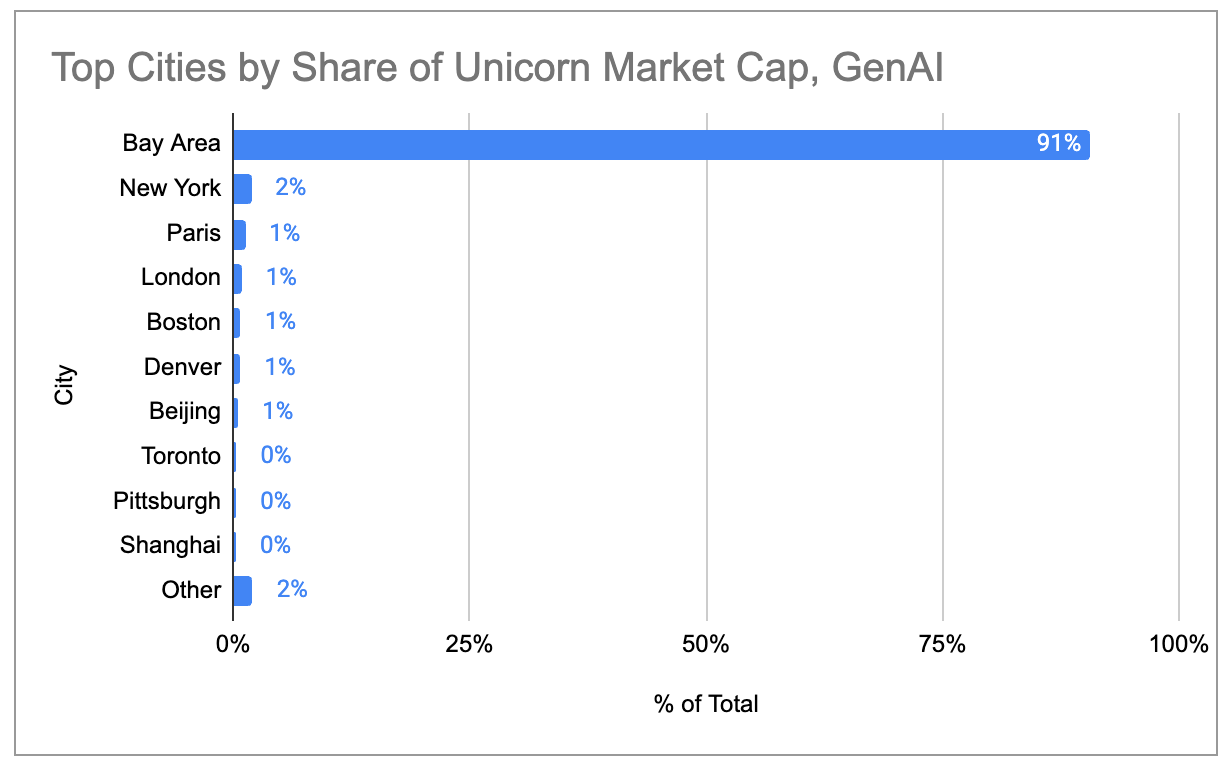
If we restrict our attention to the 97 unicorns that primarily sell products/services related to generative AI, the Bay Area is even more of a concentrated “super-cluster.” The Bay Area is home to 91% of all gen AI unicorn market cap; no other city is above 2%.
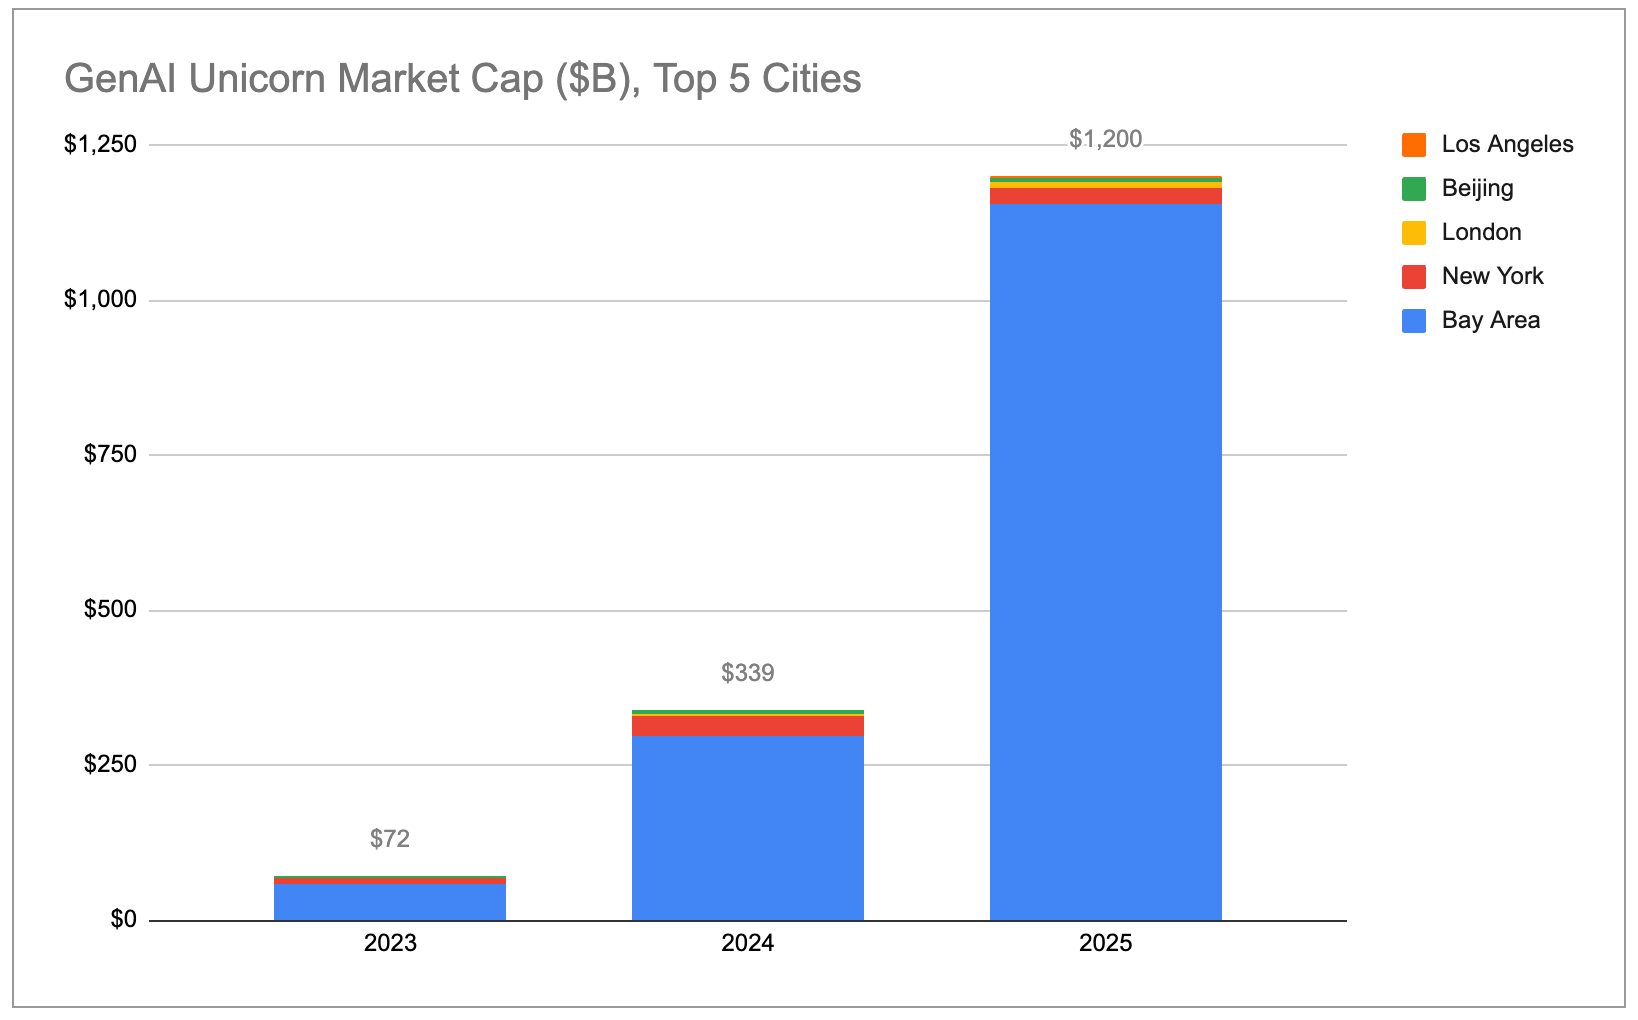
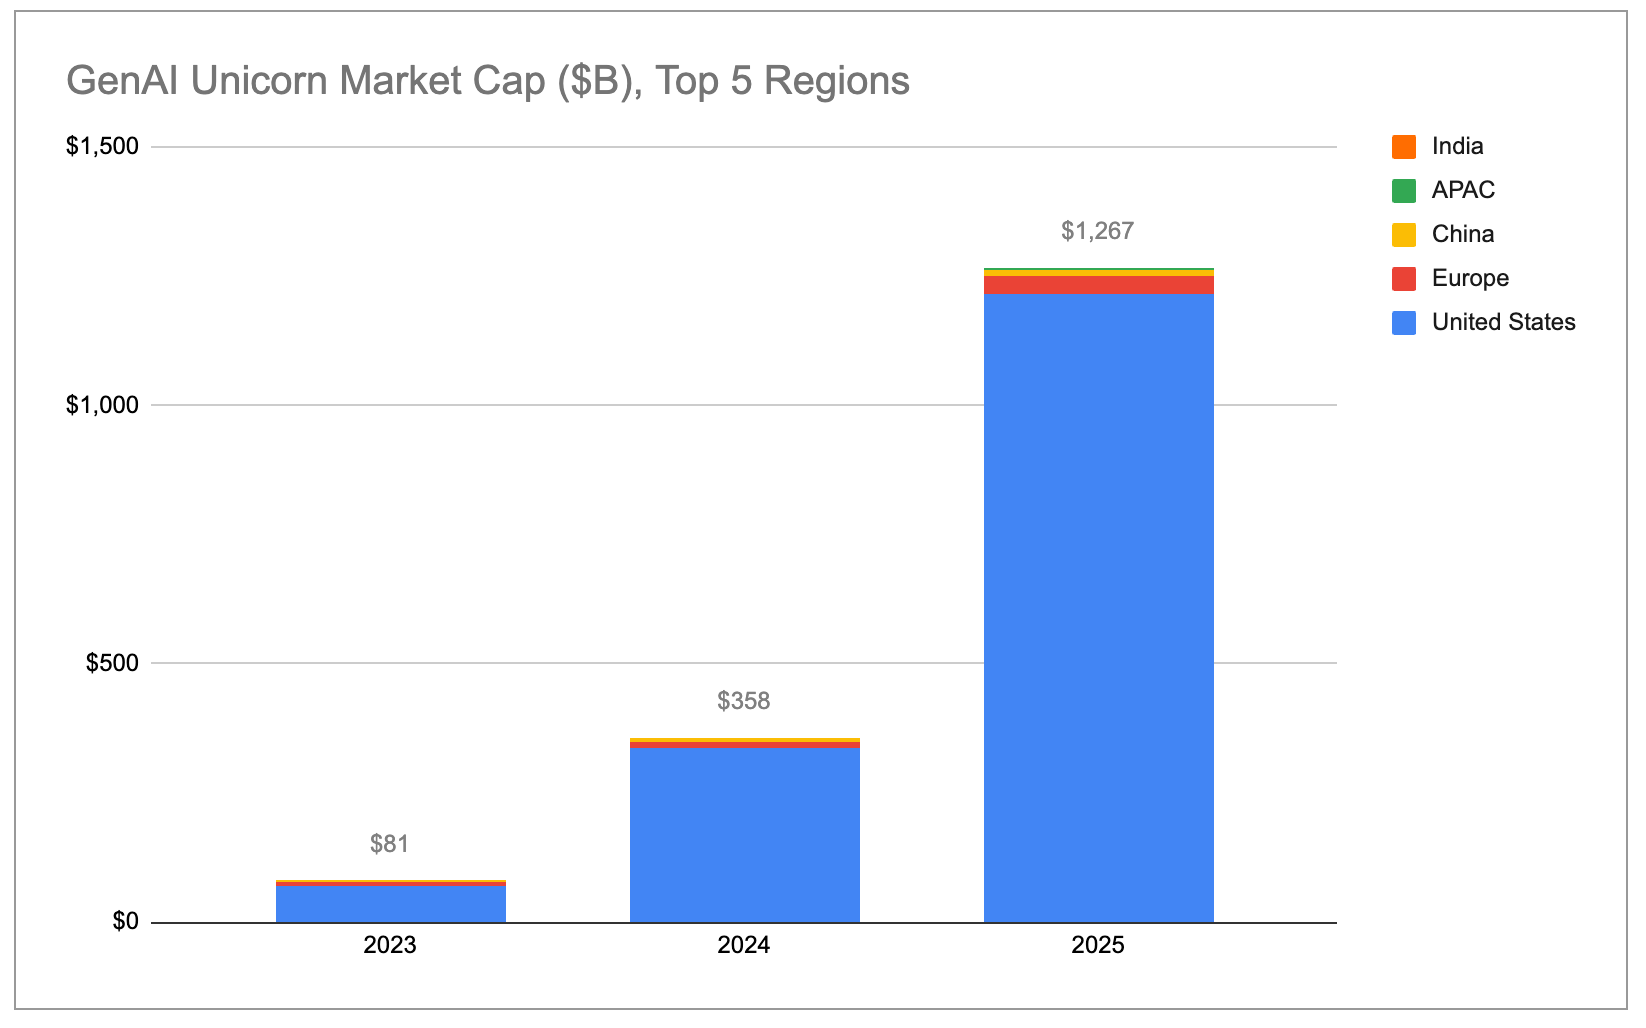
Aggregate gen AI unicorn market cap is growing exponentially, with almost all of the gains coming from the US broadly and the Bay Area specifically.
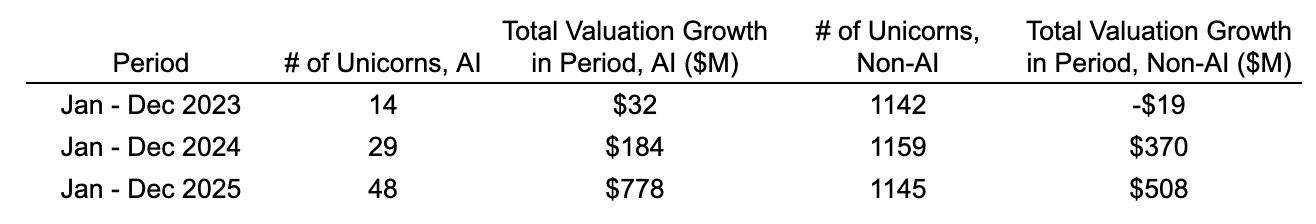
Gen AI unicorns are also growing their valuations much faster than non-AI unicorns. The 48 gen AI companies that were unicorns throughout all of 2025 grew their aggregate market cap by a total of $778B over that period. This was more than the cumulative increase across the remaining 1,100+ non-AI unicorns combined! Even if we filter out OpenAI (which added ~$343B in market cap) and Anthropic (which added ~$334B), gen AI unicorns grew their valuations by an average of ~$2.2B YoY, or 5x as much as the ~$0.44B in market cap the average non-AI unicorn added over the same period.
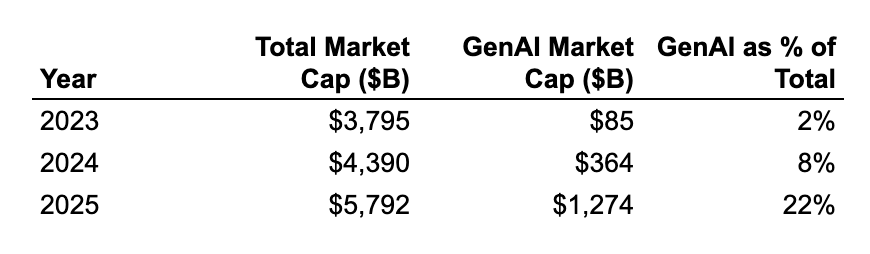
As a result, on a relative basis gen AI companies have grown from being 2% of all unicorn market cap in 2023 to 22% today. If this trend holds up, the Bay Area should continue to meaningfully expand its share of overall unicorn market cap due to its effective monopoly on top AI companies and talent.
(Note: We categorized only those companies which earn the majority of their revenue directly from generative AI adoption as “gen AI” for the purposes of this exercise. You can see the list of companies here. Note that we included some chip/hardware companies like Cerebras and TensTorrent and some infrastructure companies like Coreweave and Crusoe, but we did not include data/infrastructure companies that support AI/ML workloads more broadly such as Databricks, or robotics/defense companies that use AI/ML for autonomy such as Anduril.)
New Unicorns
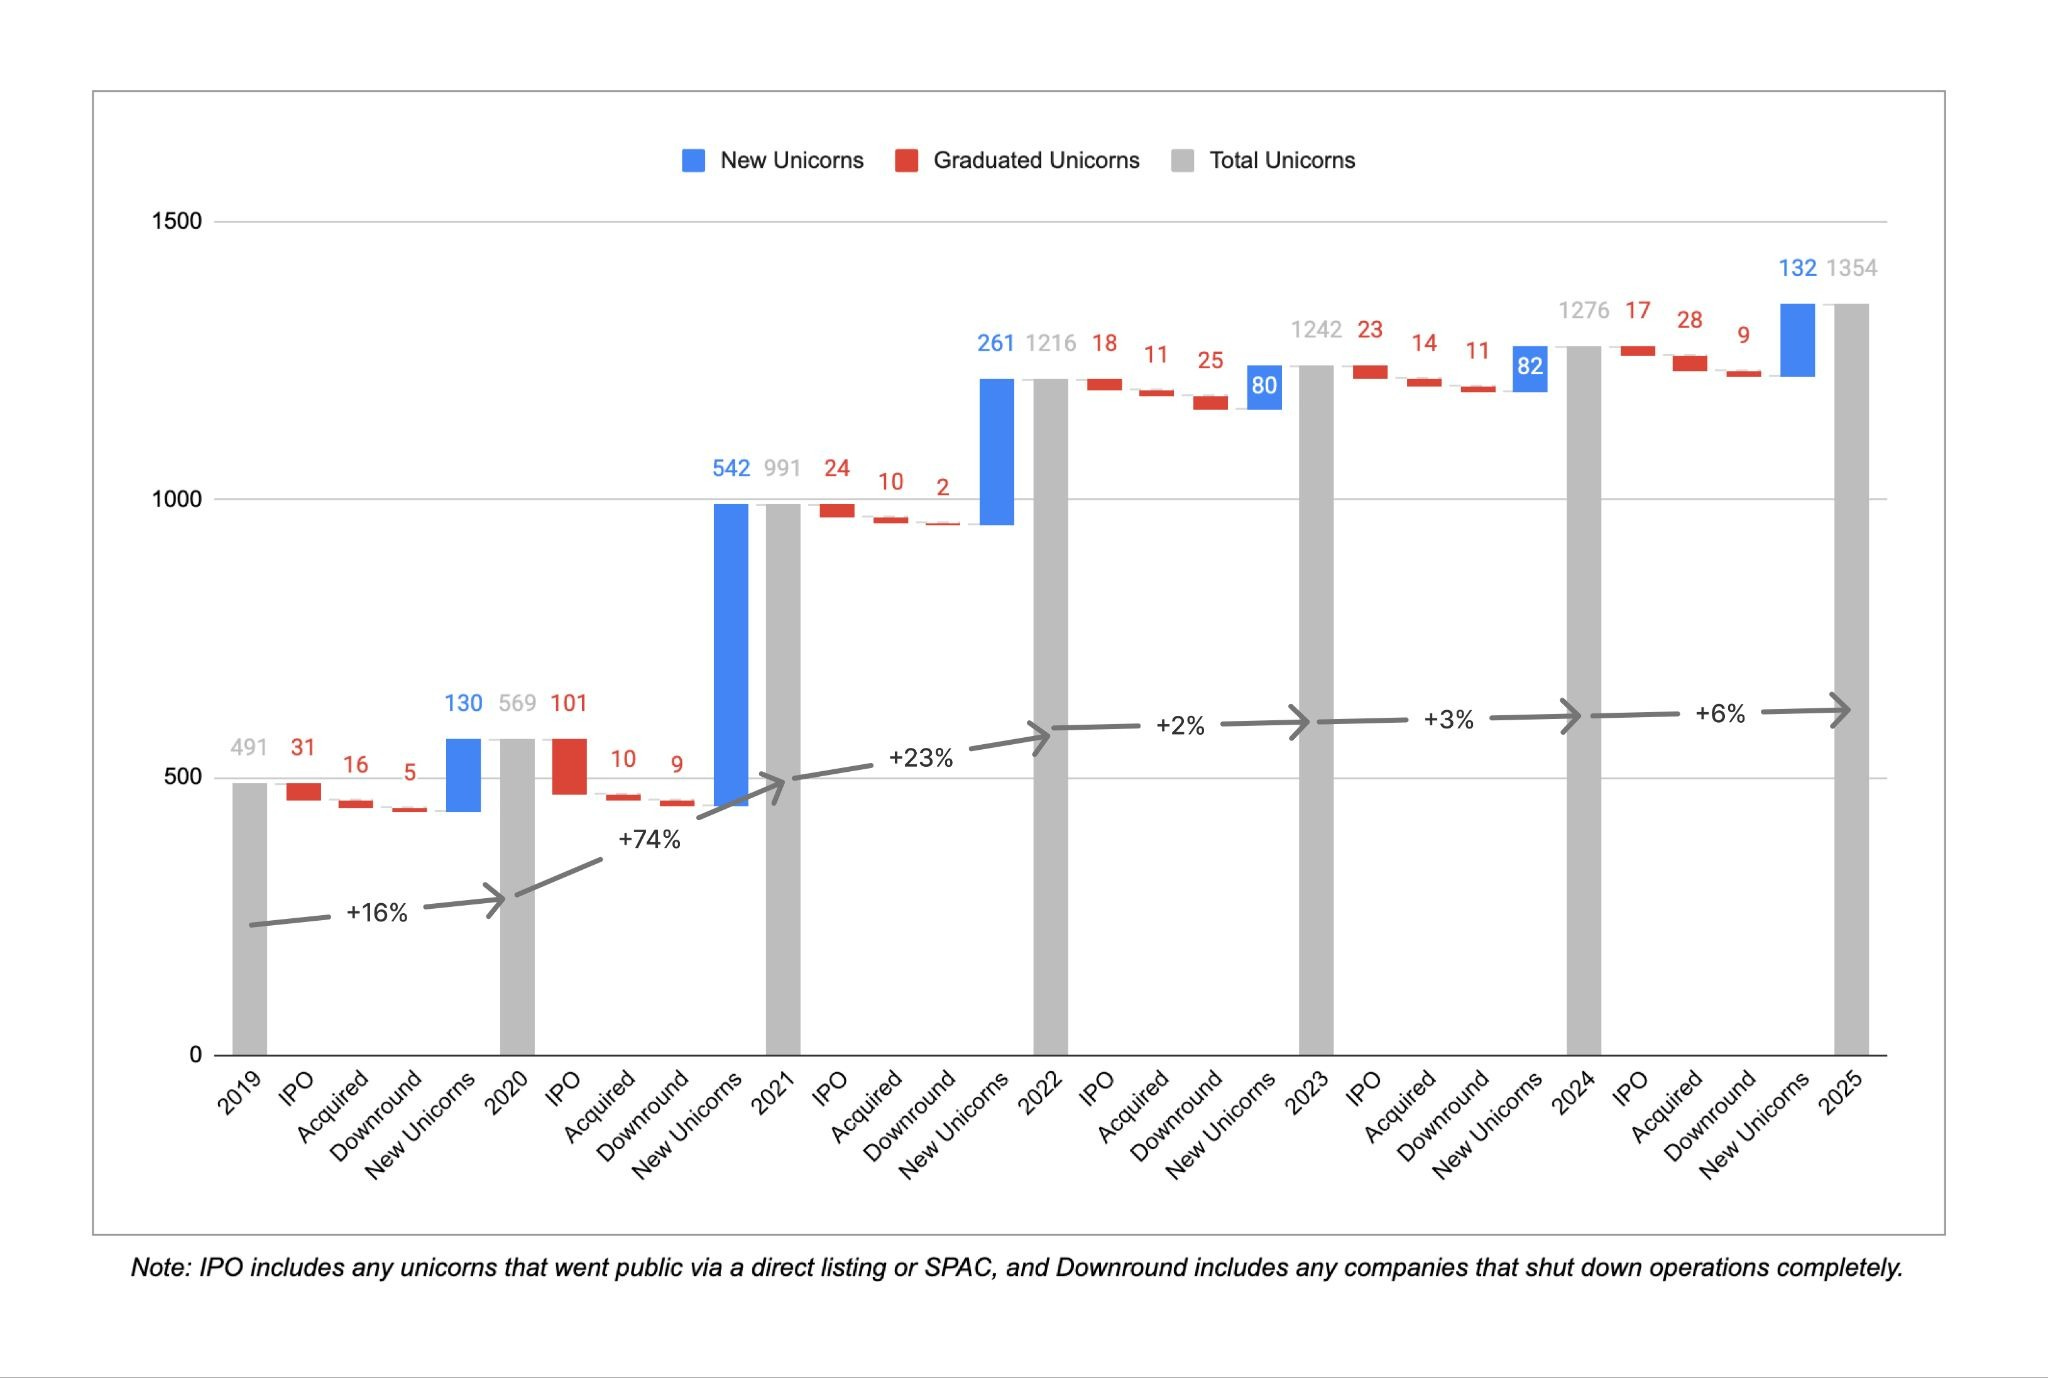
After 3 straight years of sustained growth, the rate of new unicorn creation slowed down considerably in the last 3 years. Between Dec 2019 and Dec 2022, more than ~300 companies earned unicorn status for the first time on average each year. That number fell to just ~100 new unicorns per year between Dec 2022 and Dec 2025, although 2025 saw a bit of a rebound compared to the 2 years prior. There were also 45 cases of companies losing unicorn status due to downrounds/shutdowns in the past 3 years compared to just 16 in the 3 years prior, signaling an ongoing reset from the 2021/2022 ZIRP-era days of inflated valuations.
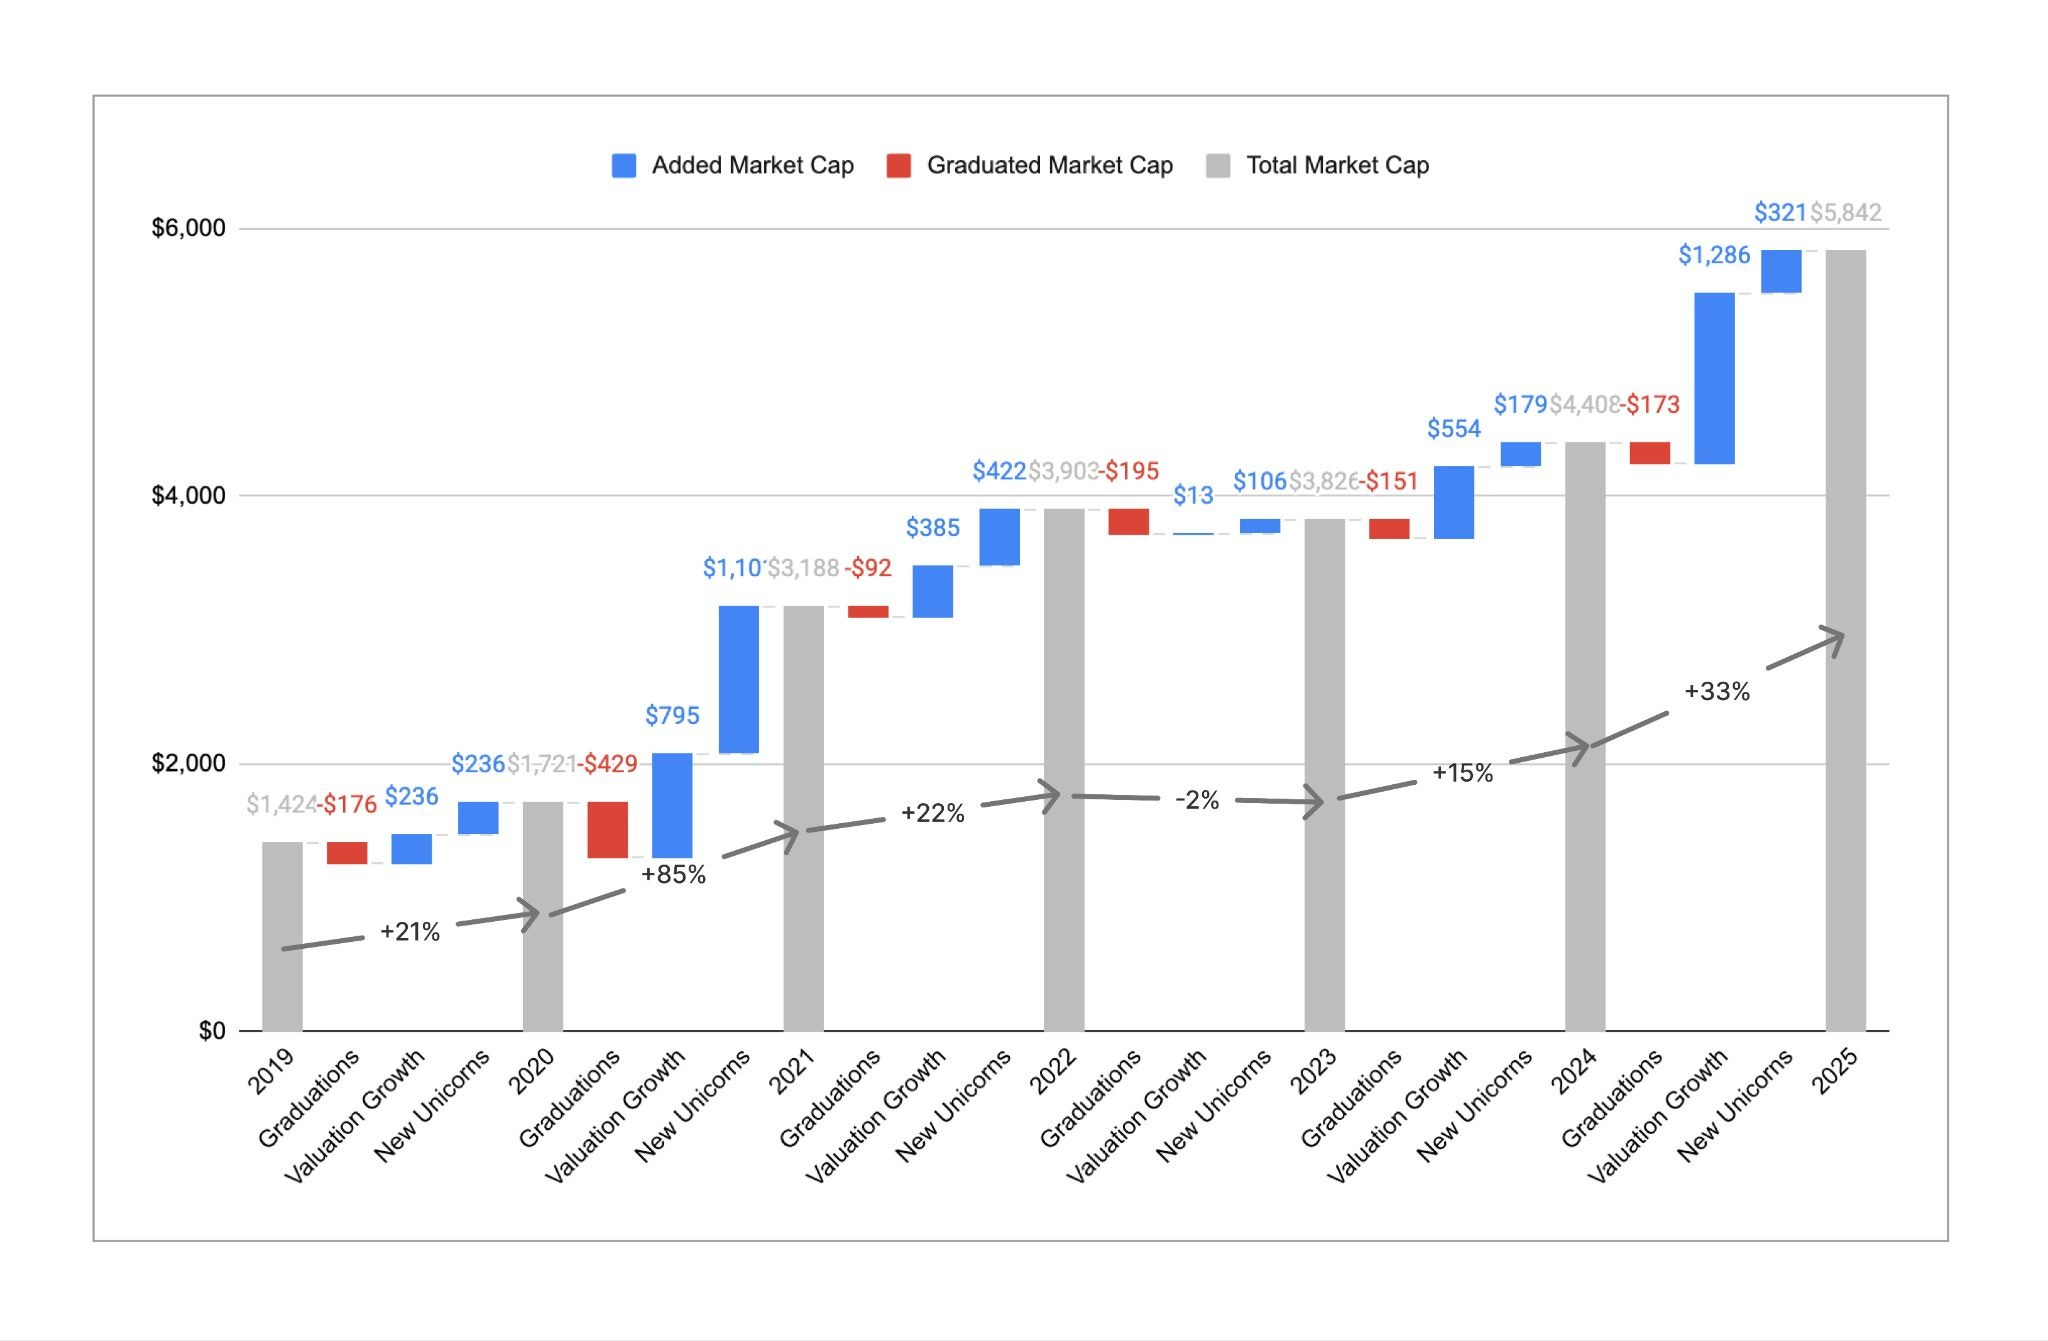
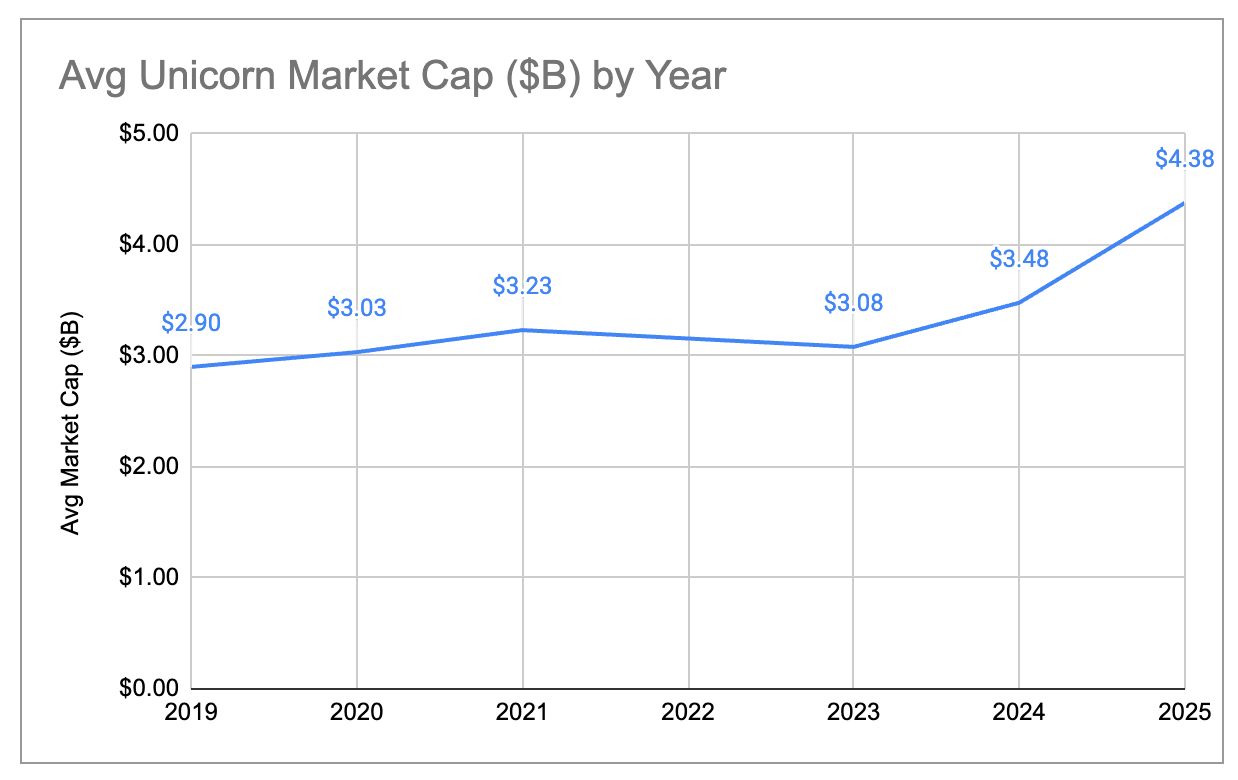
Although the number of unicorns has stayed roughly flat, the aggregate market cap of those unicorns has grown quite significantly. Total market cap across all unicorns increased by 33% in the past year, from ~$4.4T to ~$5.8T. This was a big rebound from the 2 years prior, and in particular relative to 2023 when aggregate market cap actually shrunk YoY. While market cap growth has historically been driven more by new companies becoming unicorns than by existing unicorns growing their valuation, most (~80%) of the market cap creation in 2025 was due to existing unicorns growing their valuation. As a result, the average per-unicorn market cap has increased from ~$3B to ~$4.4B, the highest mark we’ve seen in the 6 years we’ve done this analysis. While it’s harder to become a unicorn, those companies that do pass the $1B mark are on average more valuable and faster-growing than previous years.
Recent vs Older Unicorns
One way to offset the effect of inflated valuations is to look only at those companies that became unicorns after the end of ZIRP. Here is what the distribution of unicorn market cap looks like for companies that became unicorns prior to 2023 vs after 2023:
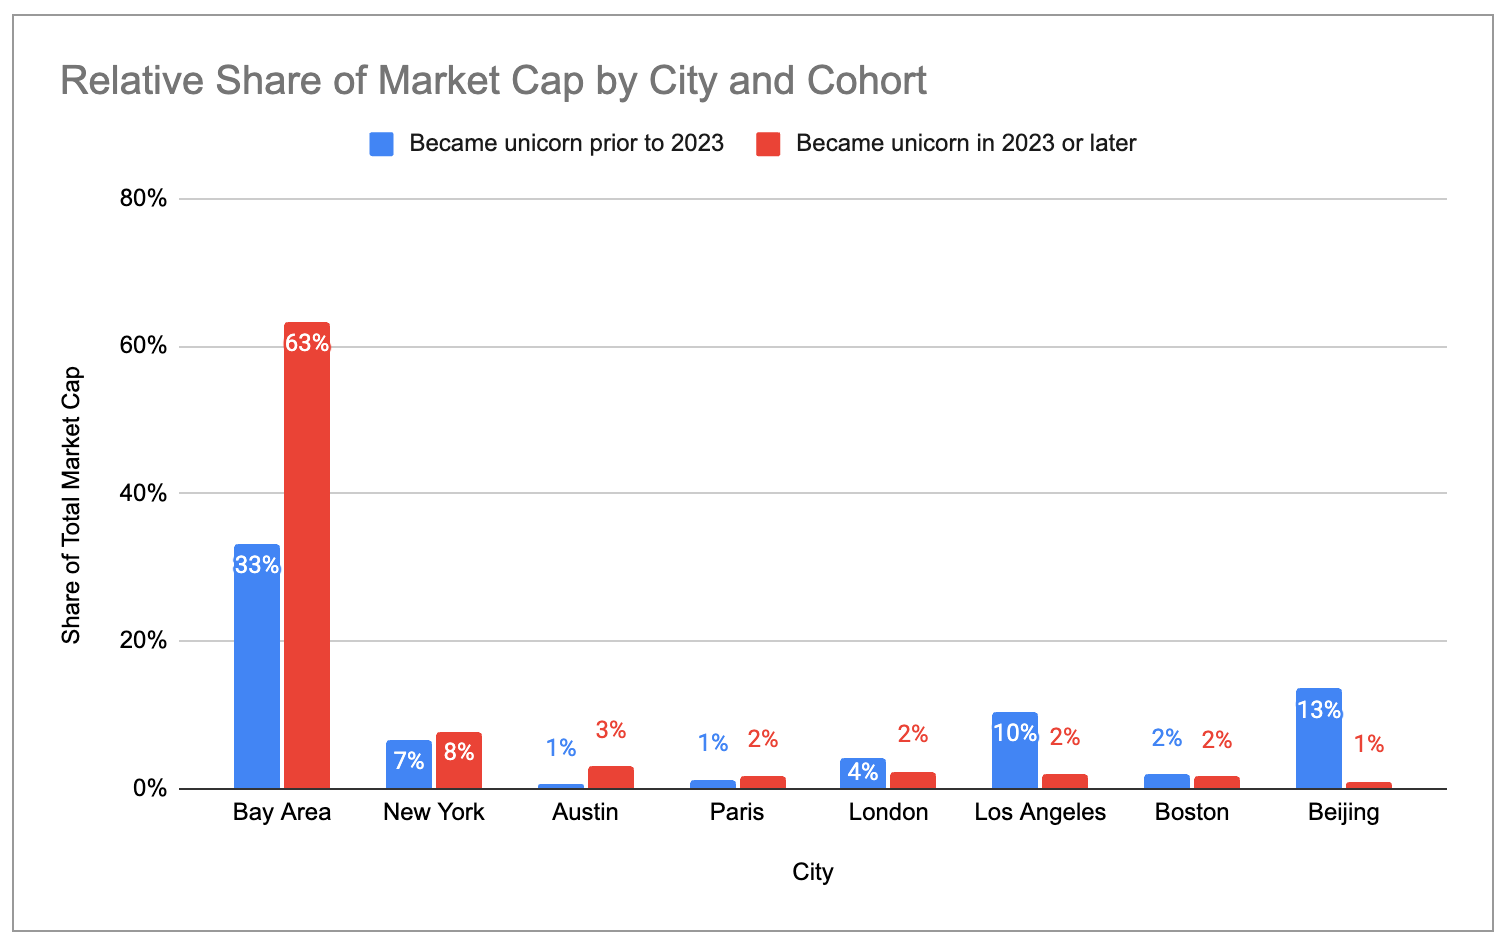
Recent unicorns tend to cluster more in the US and less in Europe and China. The Bay Area has 63% of market cap across all net-new unicorns minted since 2023, compared to 33% of market cap across older unicorns.
Stale Unicorns
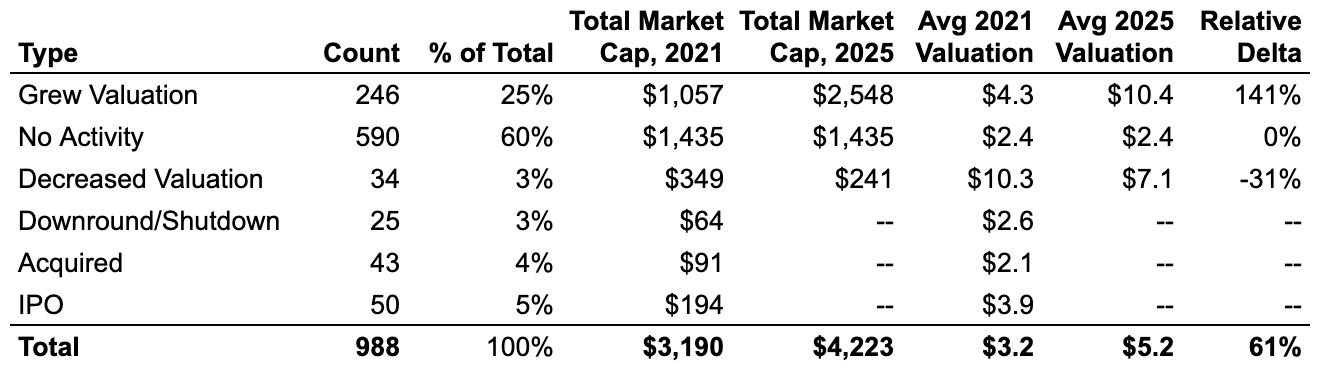
Roughly 60% of the nearly 1,000 companies that were unicorns as of December 2021 have kept their unicorn status without raising any new round. These “stale” unicorns raised enough capital to survive for the past 4 years, but haven’t been able to grow beyond their ZIRP-era valuation. Collectively, the stale unicorns from 2021 account for ~$1.4T of present day unicorn market cap, nearly 25% of the global total.
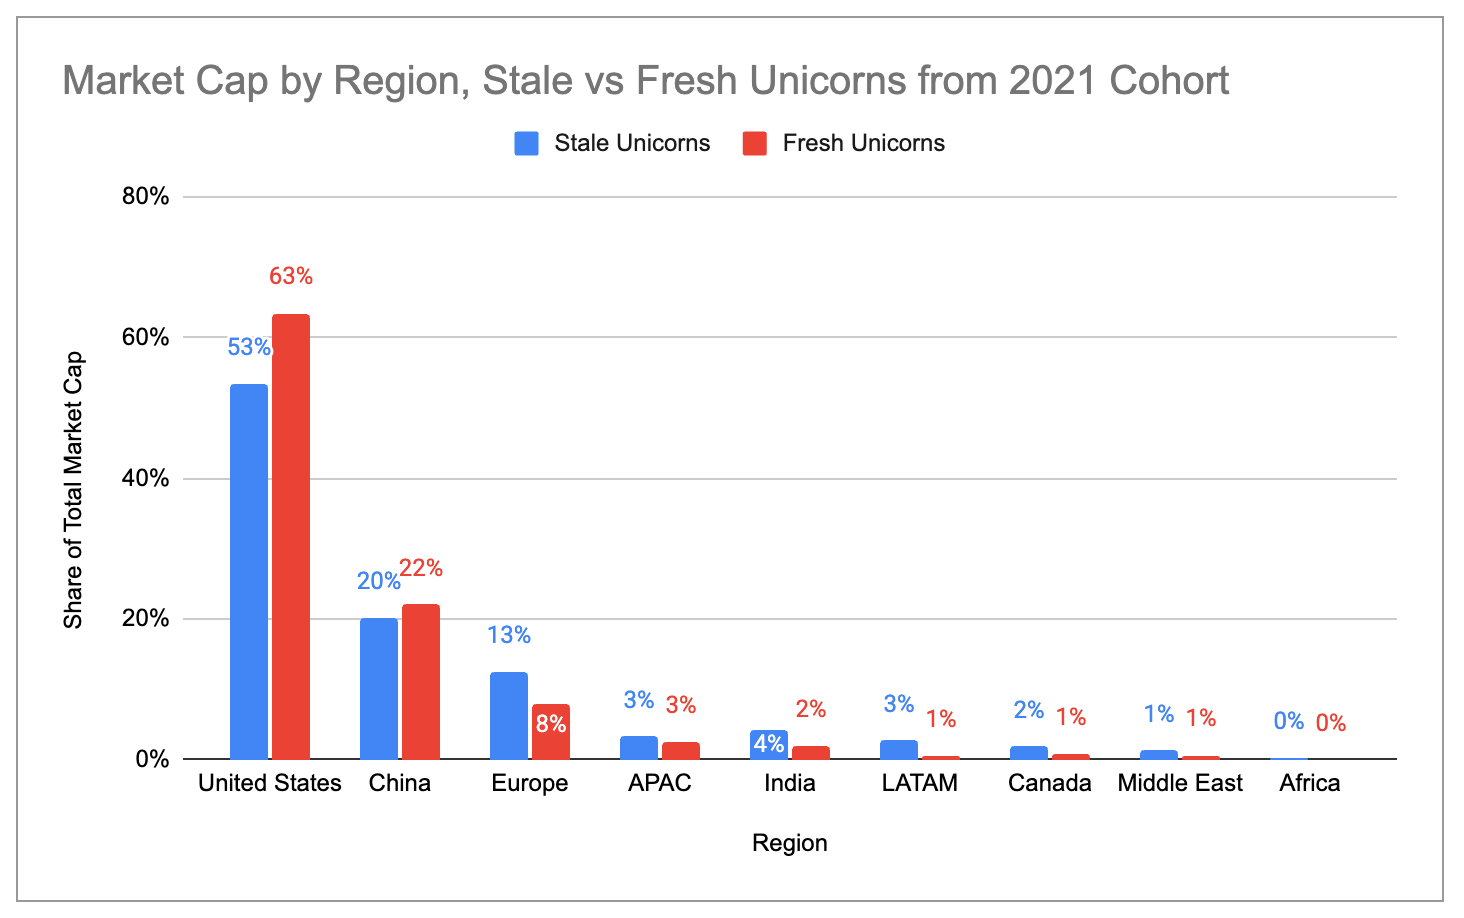
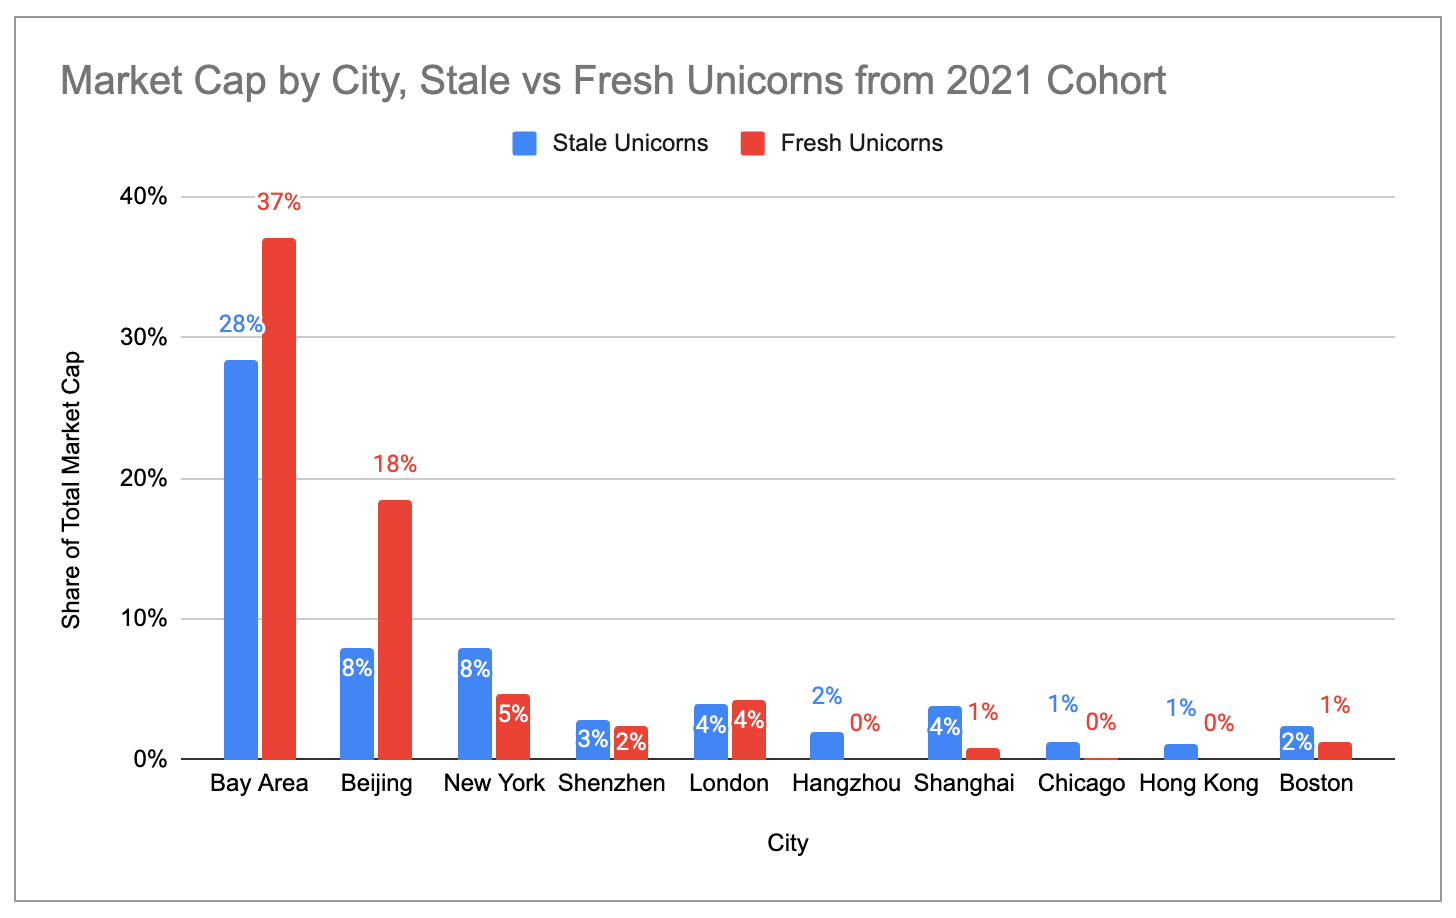
Both the US broadly and the Bay Area specifically have a much higher share of “fresh” unicorns (i.e. unicorns from 2021 that have raised new rounds since) than of stale unicorns. By comparison, Europe, India, LATAM and New York have higher concentrations of stale unicorns than of fresh ones.
US Clusters
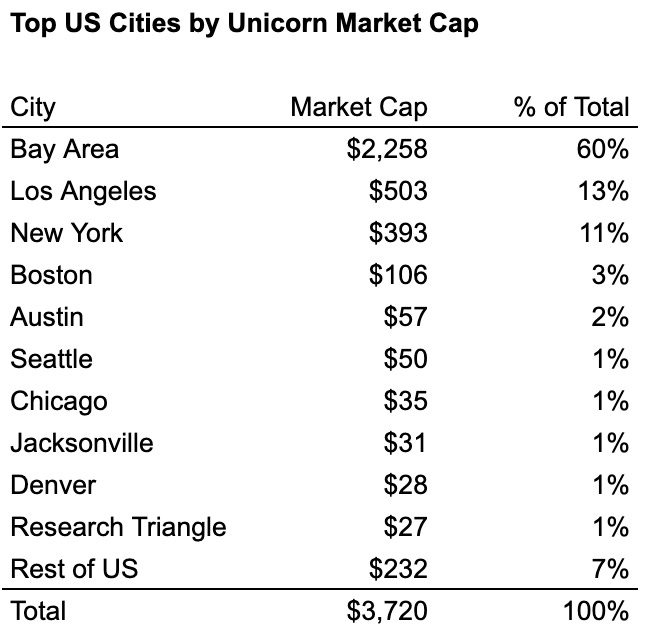
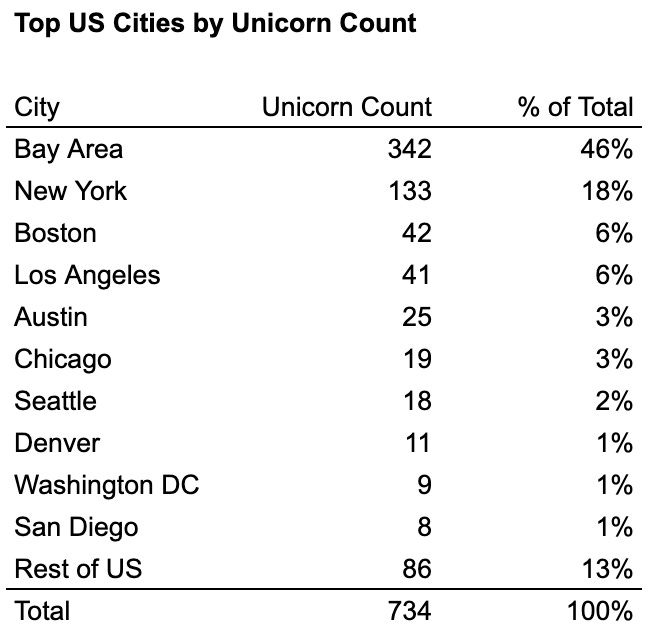
Within the US, four industry-towns combine to make up ~76% of all unicorns and ~87% of all unicorn market cap: the Bay Area, New York, Los Angeles, and Boston. Among these, the Bay Area is clearly the biggest hub, with more than 2x as many unicorns and more than 4x as much market cap as second-place New York/Los Angeles.
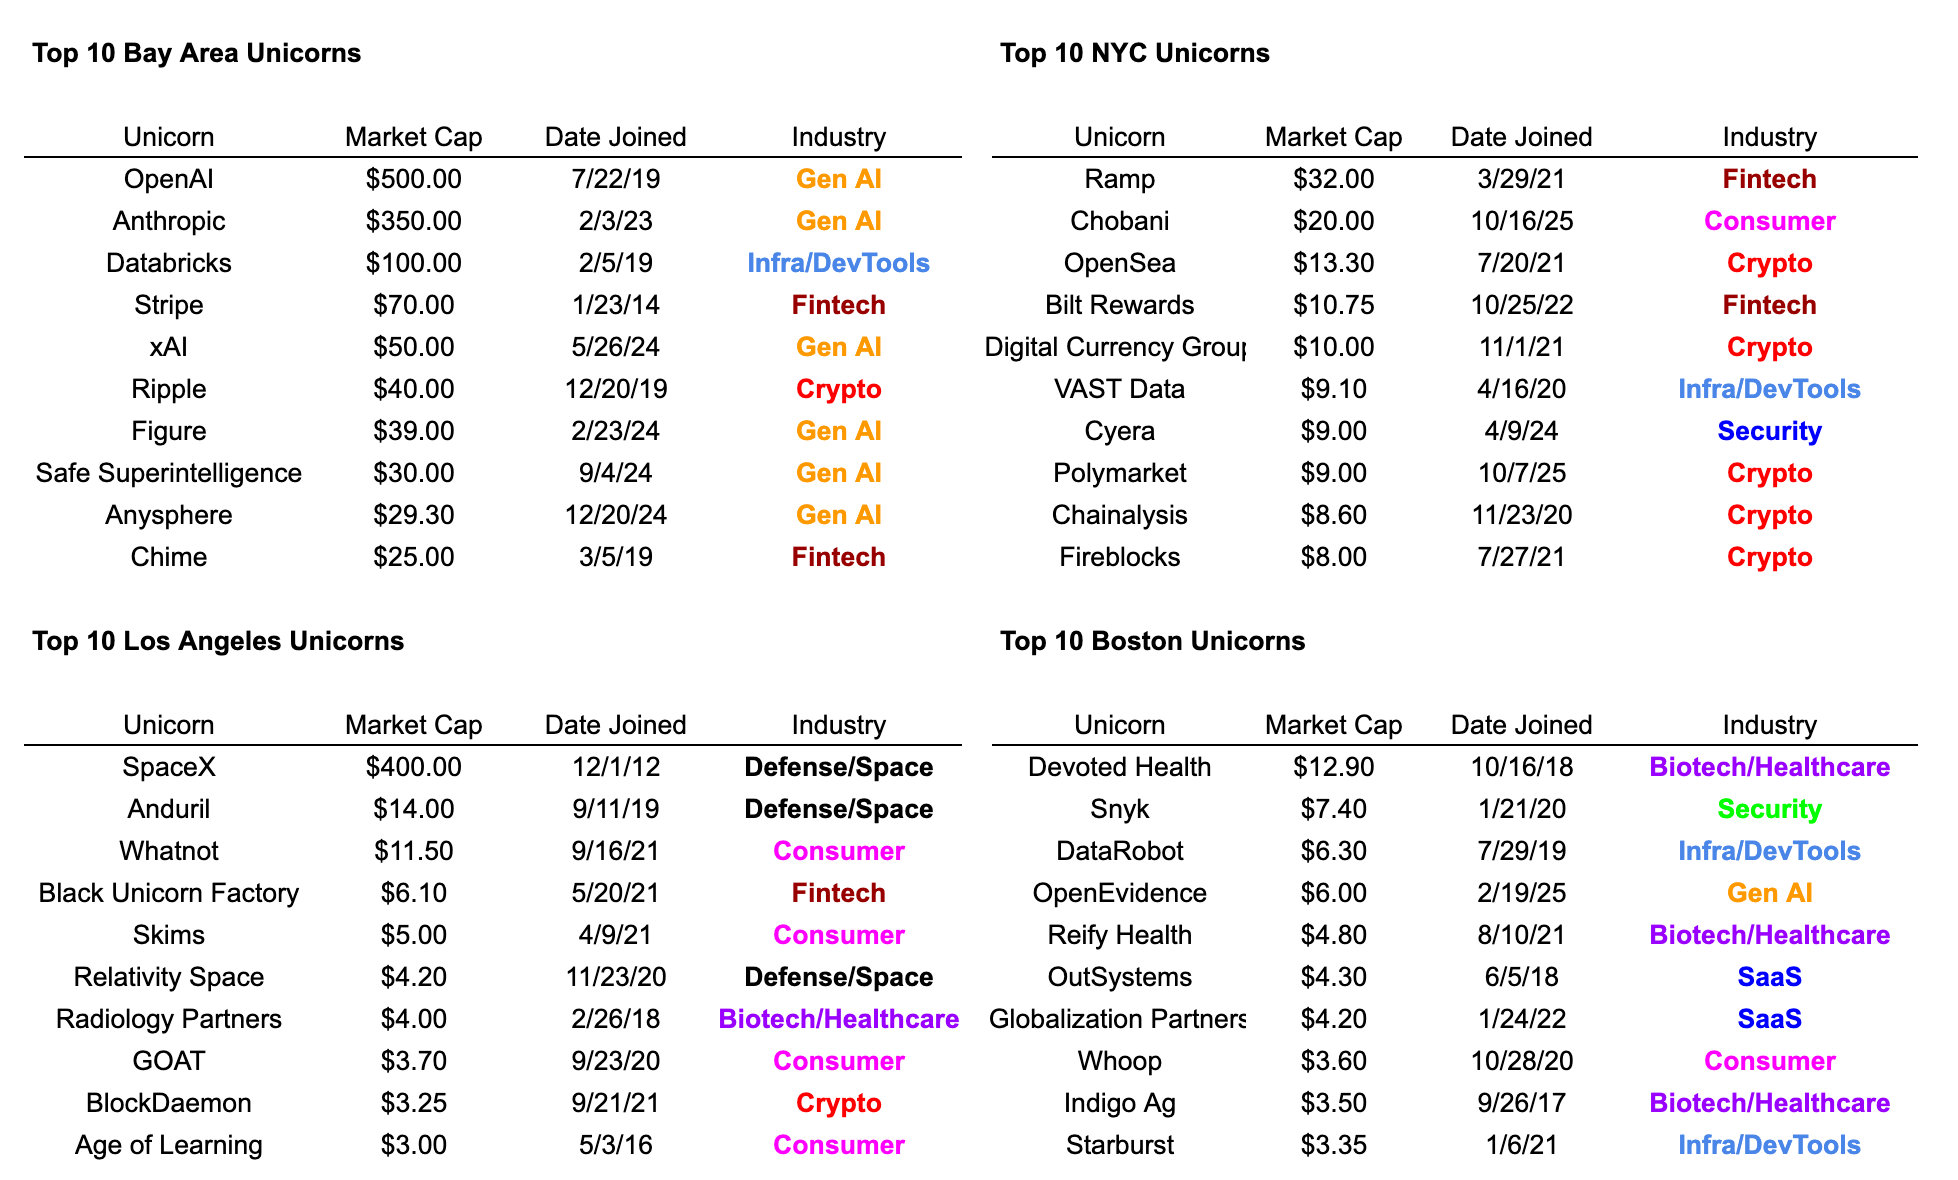
If we look at the 10 most valuable unicorns in the main US hubs, we can see that industry-towns tend to consolidate around specific industries to various extents:
The Bay Area is a gen AI cluster (6 of top 10)
New York is a fintech/crypto cluster (7 of top 10)
LA is a defense/space (3 of top 6) and consumer (4 of top 10) cluster
Boston is a bit more balanced but relatively speaking more of a biotech/healthcare cluster (3 of top 10)